Visual Exhibits & Findings
A clean, publication-grade gallery displaying the 14 visual outputs generated by the R network meta-analysis pipeline, paired with concise empirical takeaways.
Transparency & Dataset Disclosure
This portfolio demonstrates a reproducible statistical workflow in R. The evaluated interventions (Drug A through Drug F) and comparisons use a synthetic / simulated benchmark dataset designed for computational testing and methodological demonstration. It does not contain actual patient data.
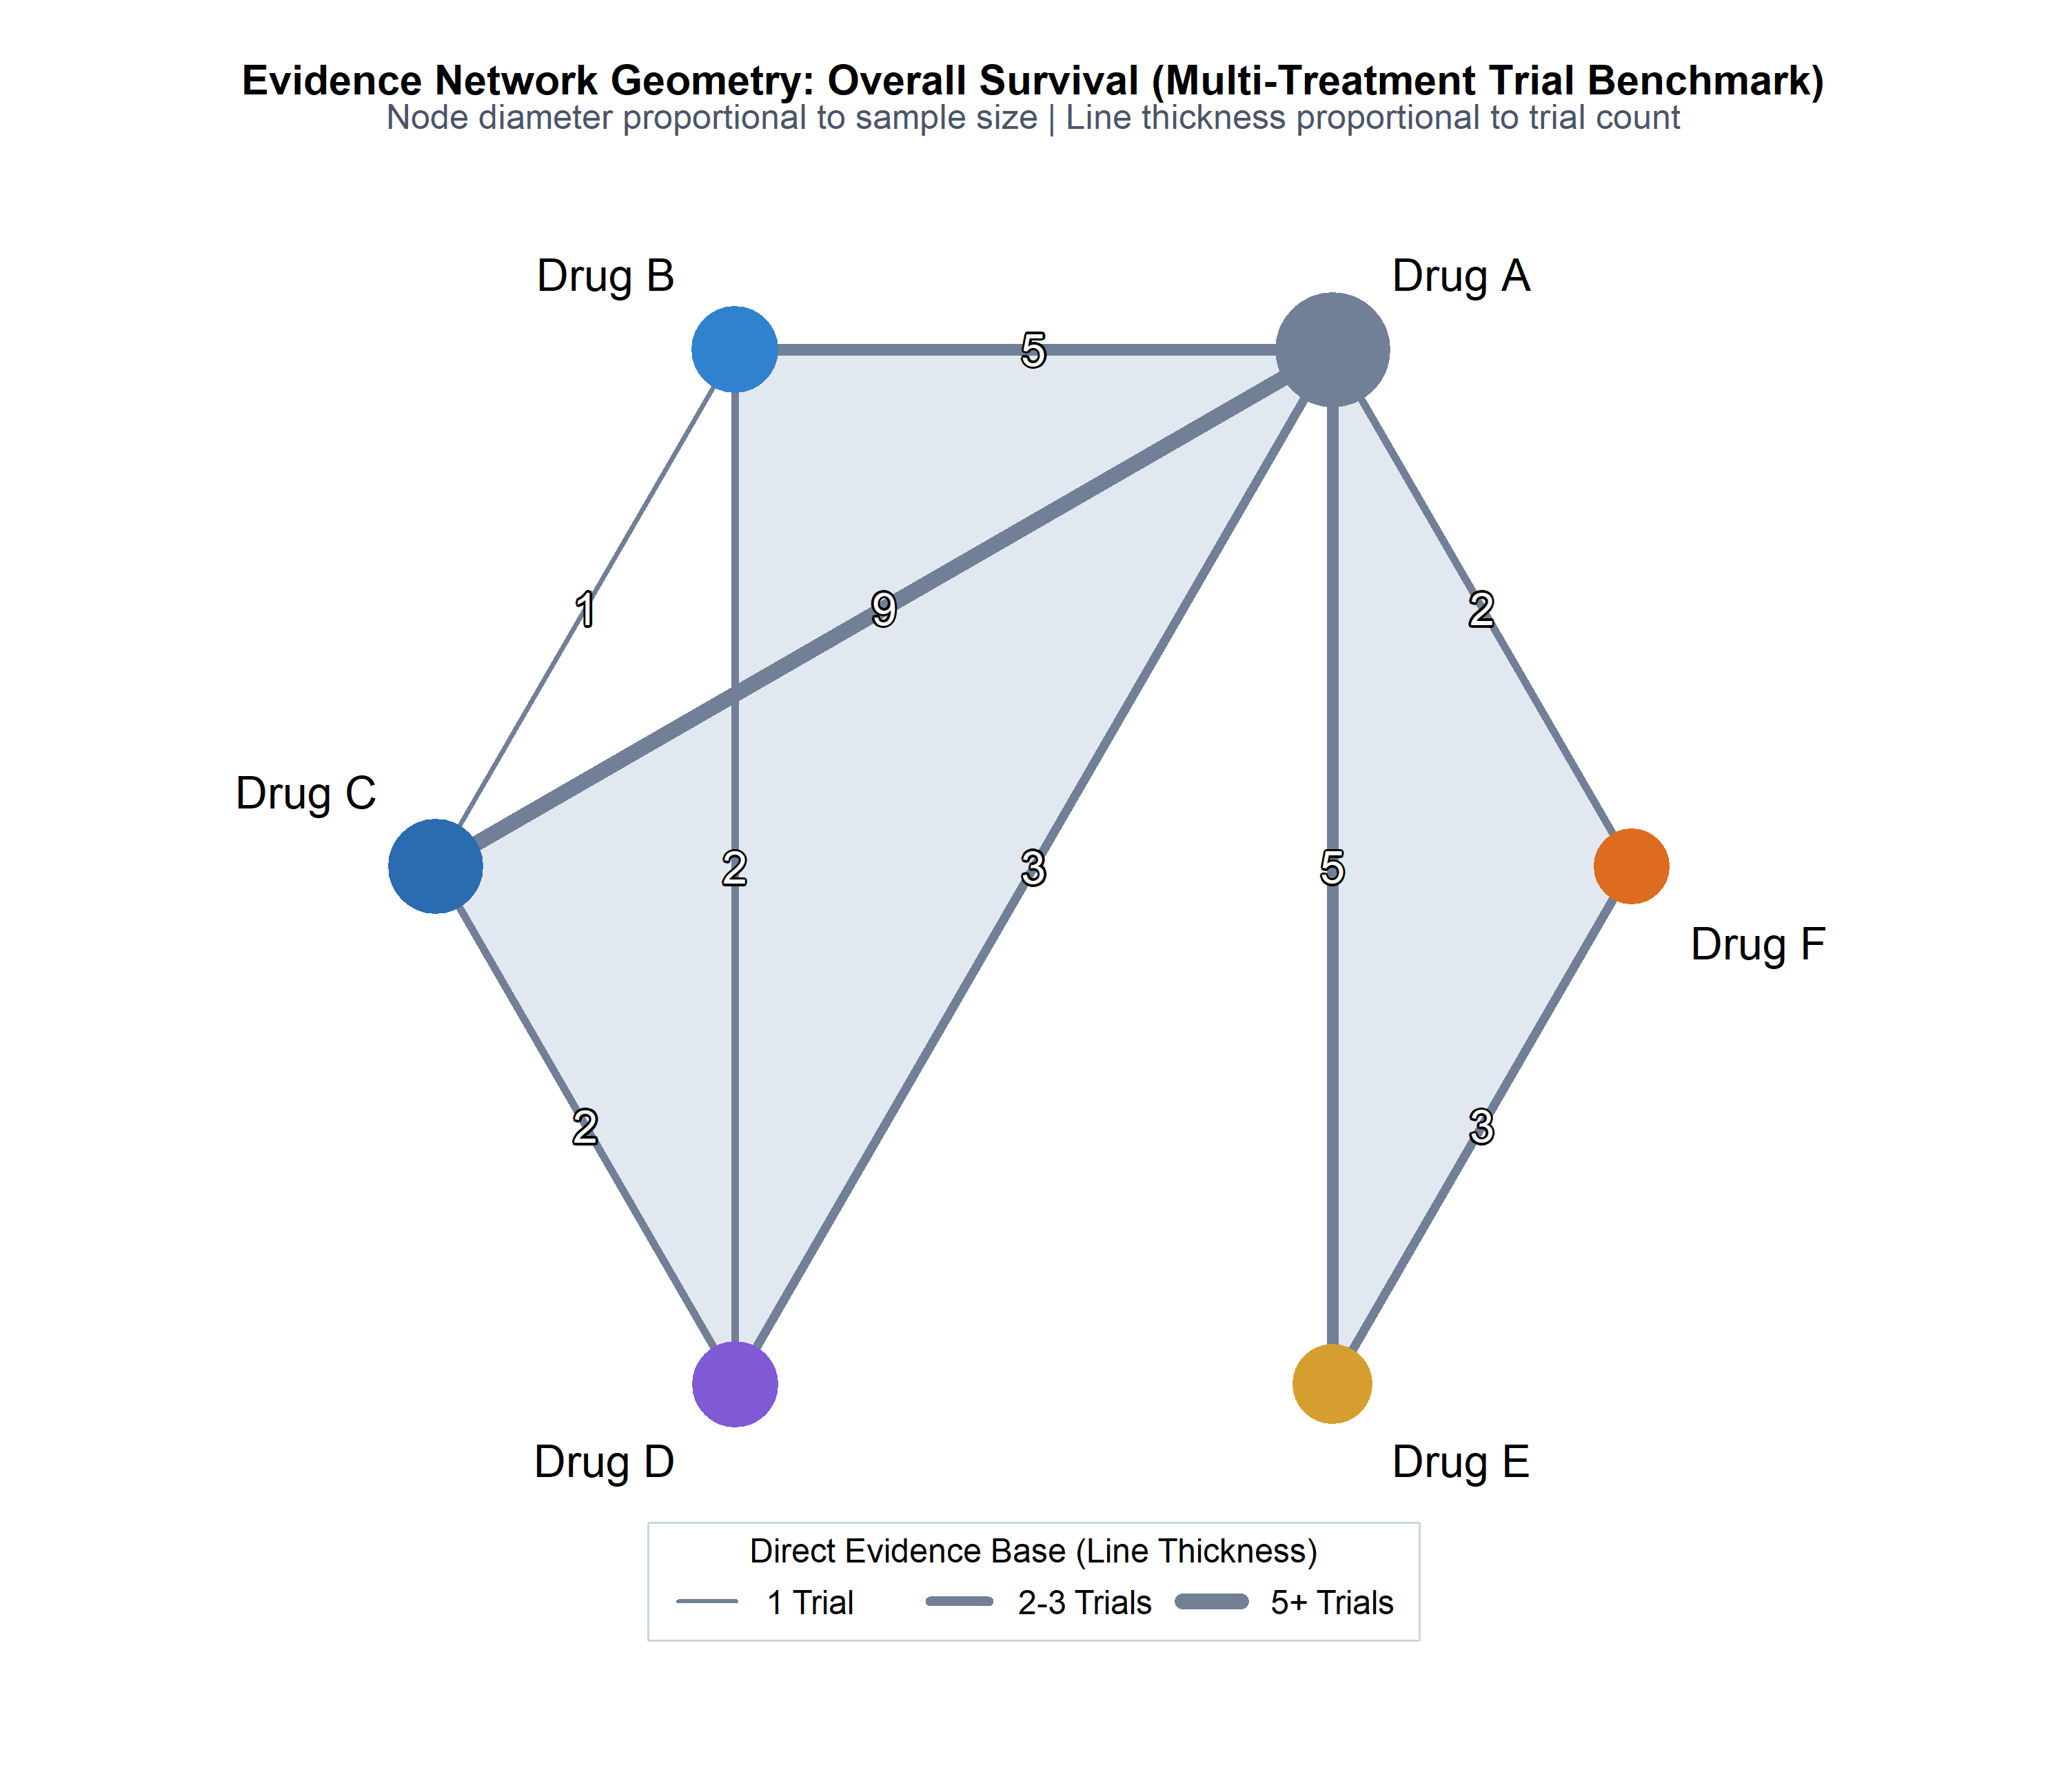
A fully connected evidence network of 6 treatment regimens centered on the control anchor Drug A, incorporating multi-arm trials with no disconnected nodes or isolated pathways.
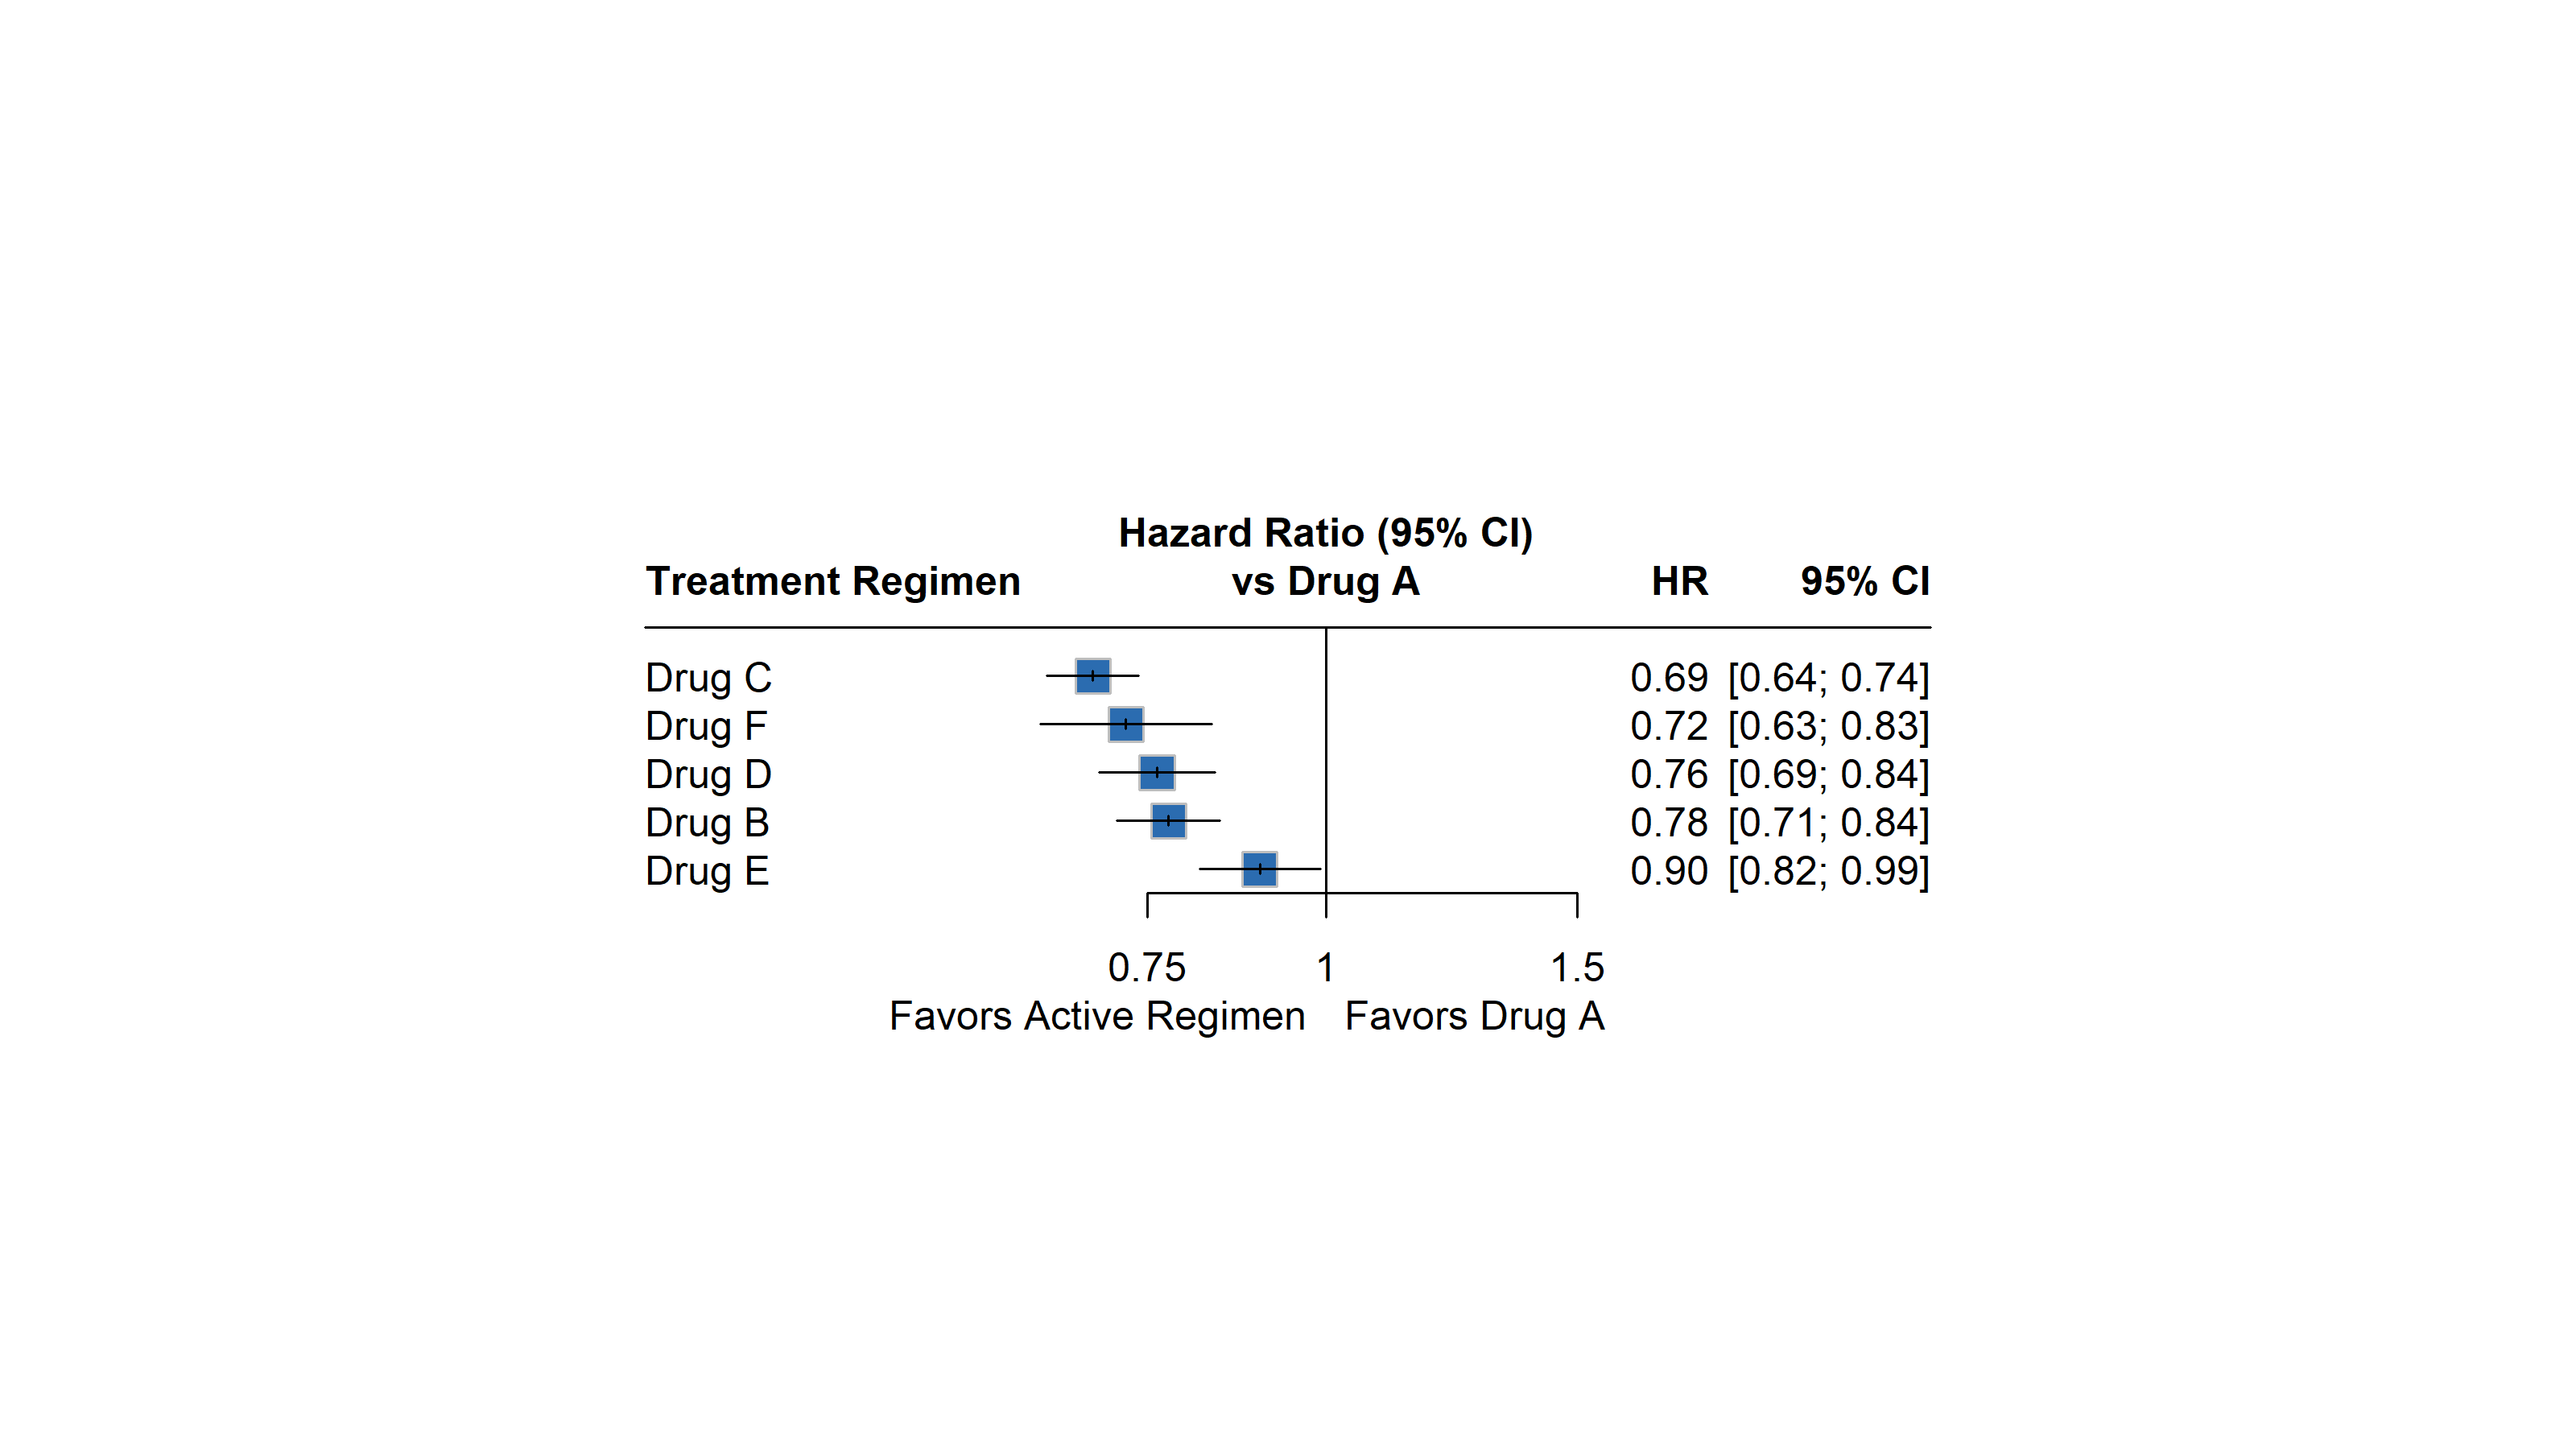
All 5 active regimens significantly reduce the hazard of death compared to Drug A. Drug C (HR = 0.69) and Drug F (HR = 0.72) provide the greatest overall survival benefits.
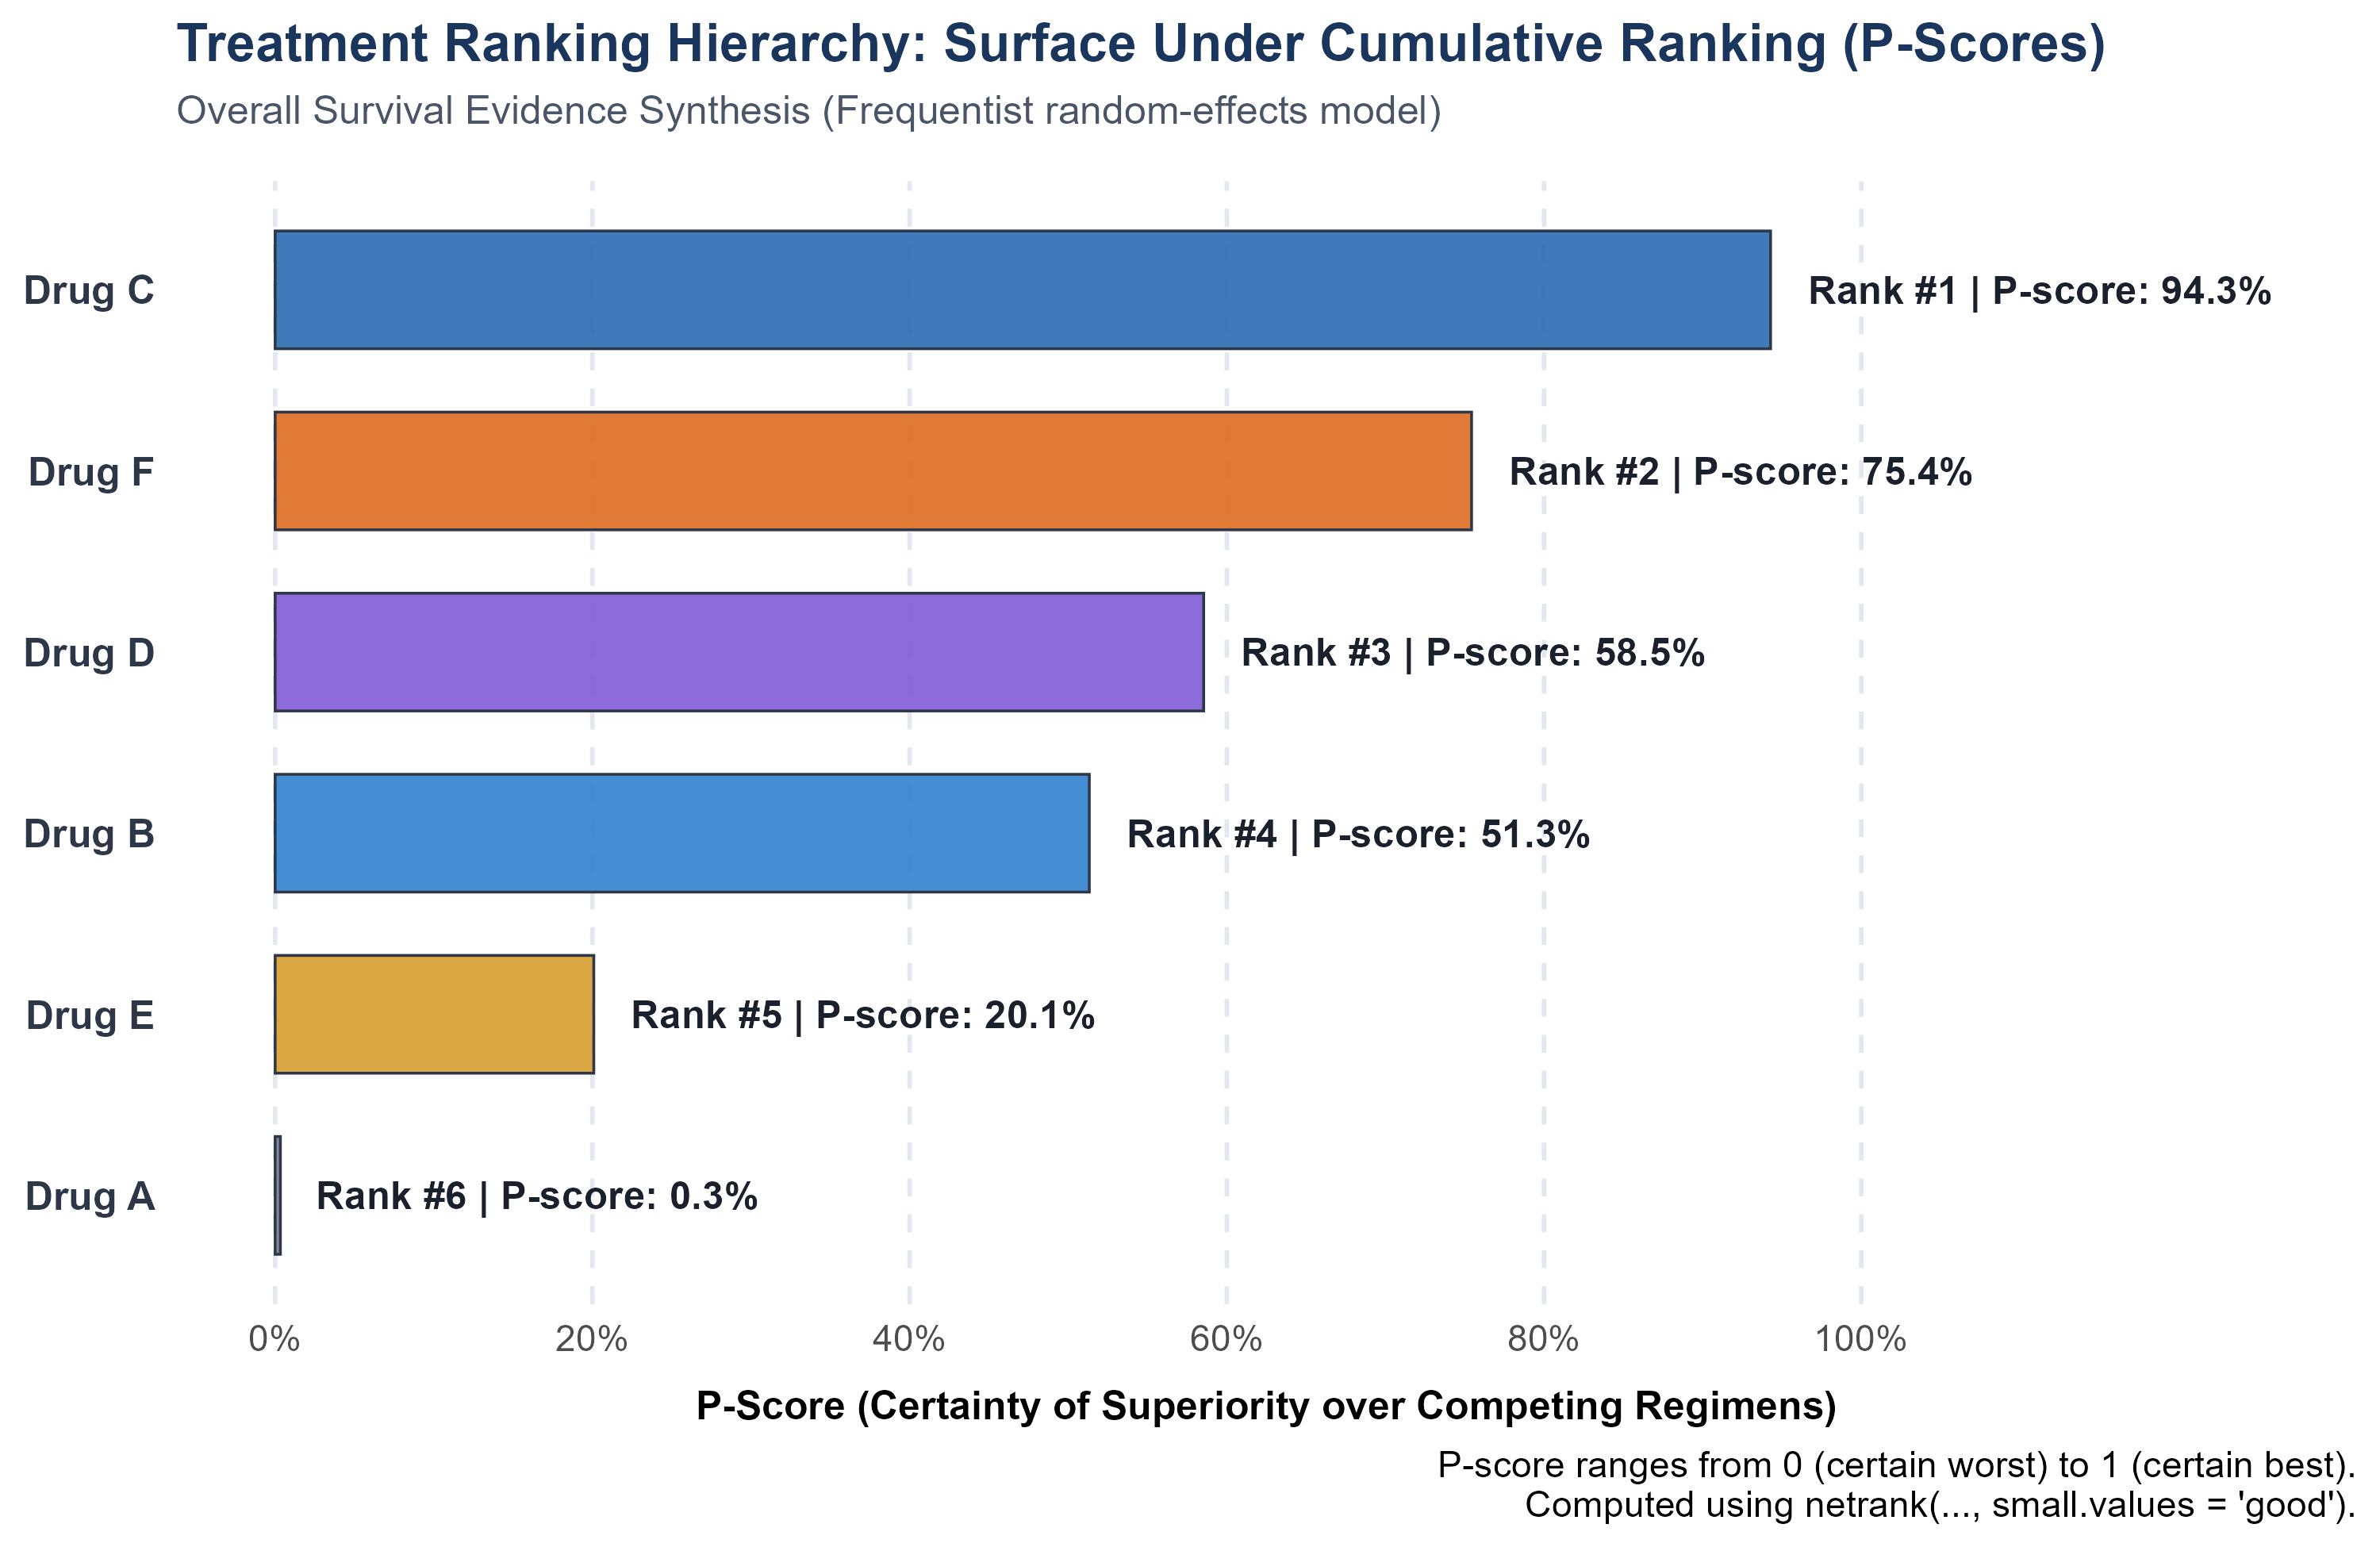
Drug C leads the global treatment hierarchy with the highest P-score of 0.9428 (Rank 1), followed by Drug F (0.7543), Drug D (0.5854), Drug B (0.5133), and Drug E (0.2009).
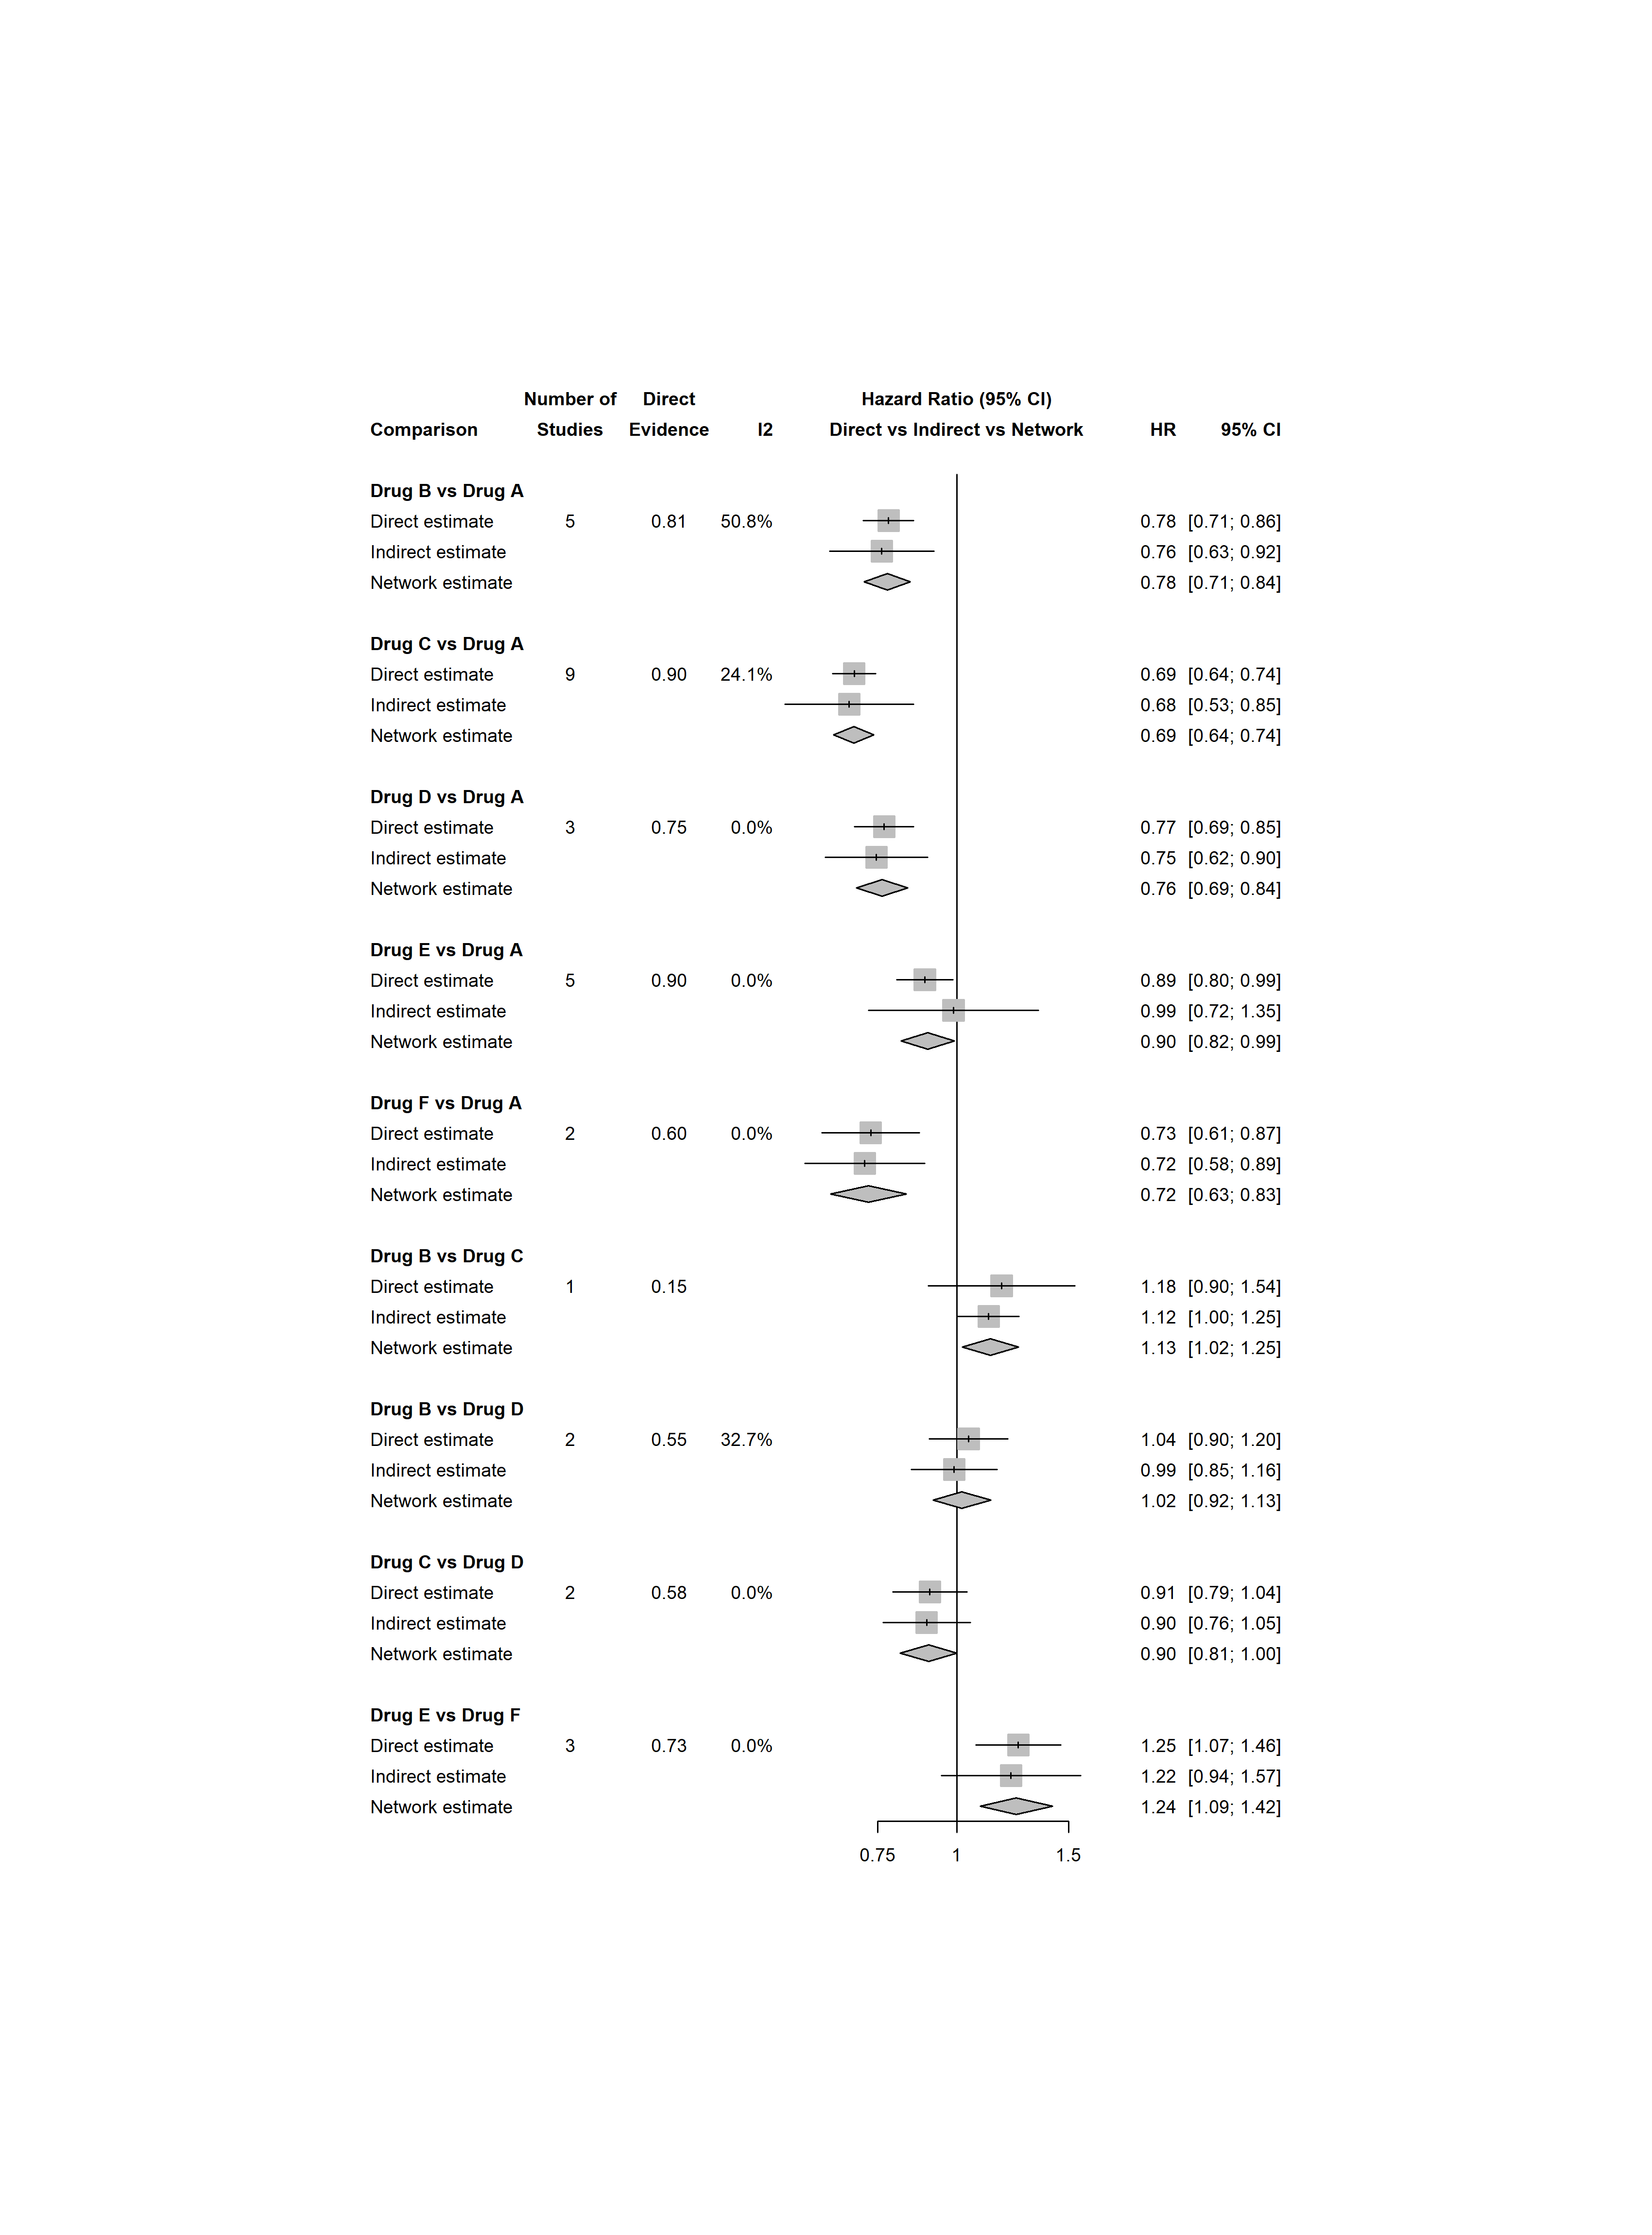
Direct and indirect effect estimates show close statistical alignment across all closed network loops (all p > 0.40), confirming the validity of the transitivity assumption.
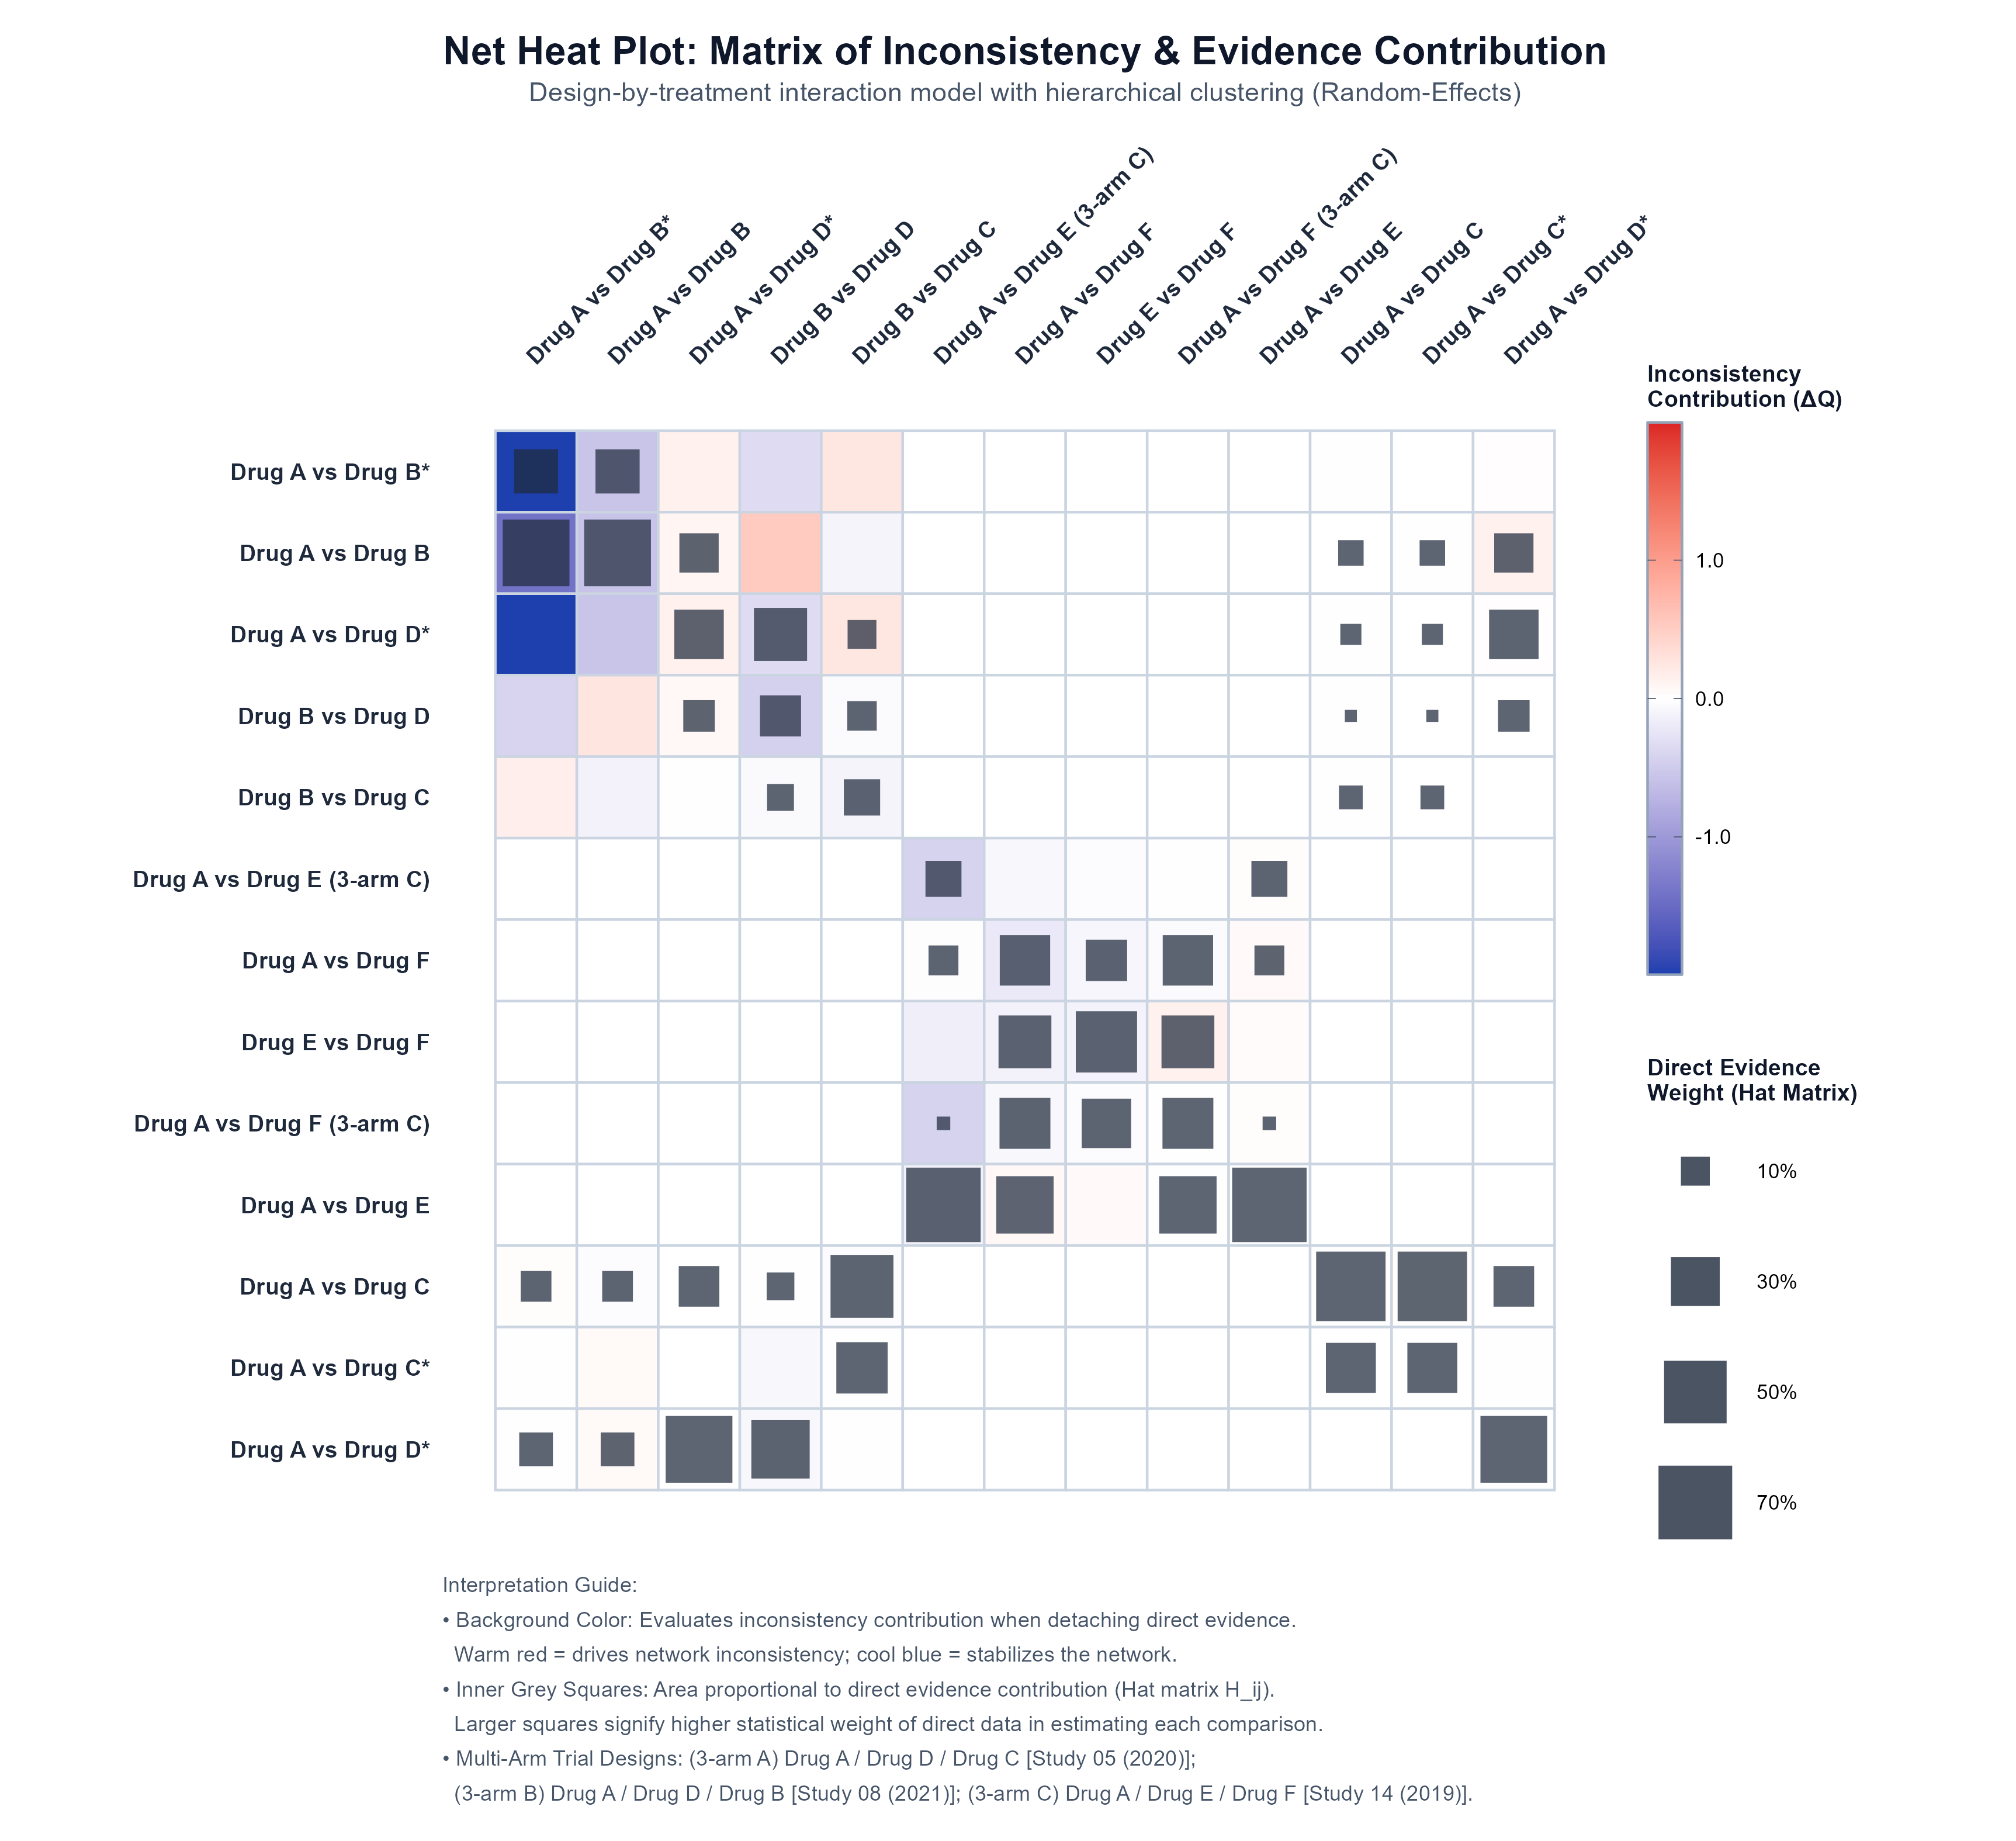
Net Heat matrix diagnostics confirm neutral background tiles with no localized hot spots or excessive leverage driving tension in the network.
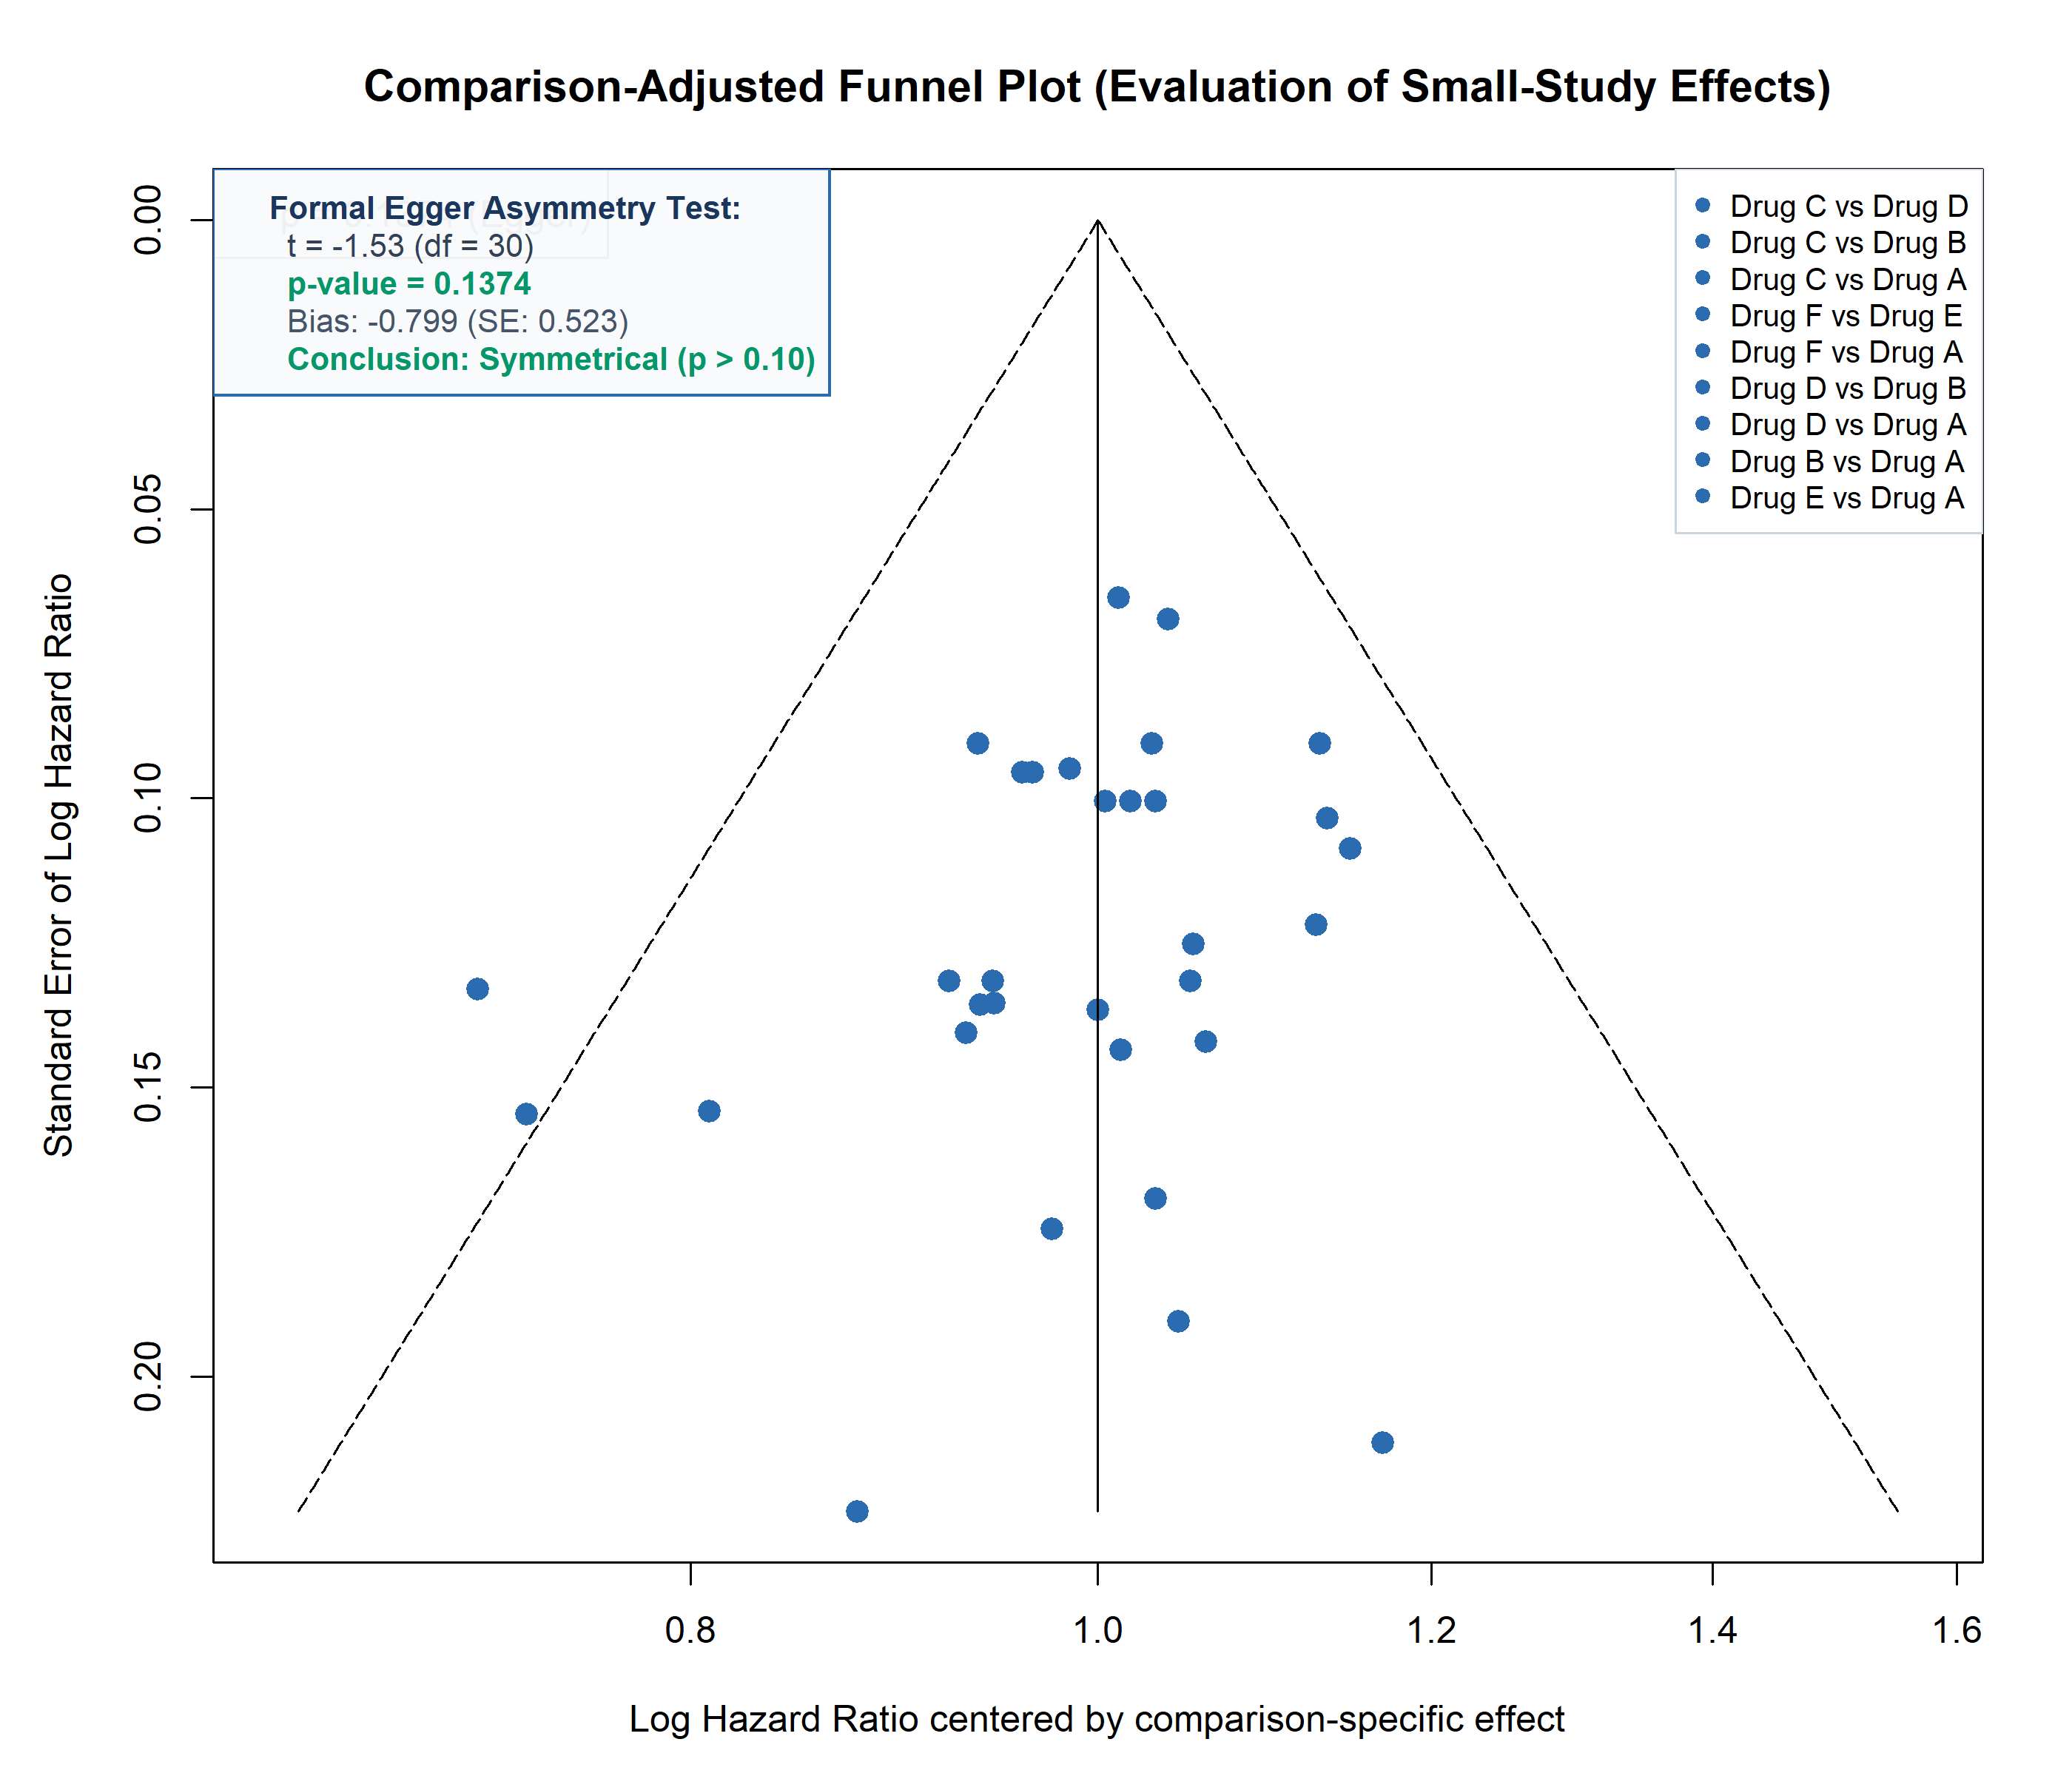
Effect estimates are symmetrically distributed around zero, and Egger's linear regression test is non-significant (p = 0.137), indicating absence of small-study effects.
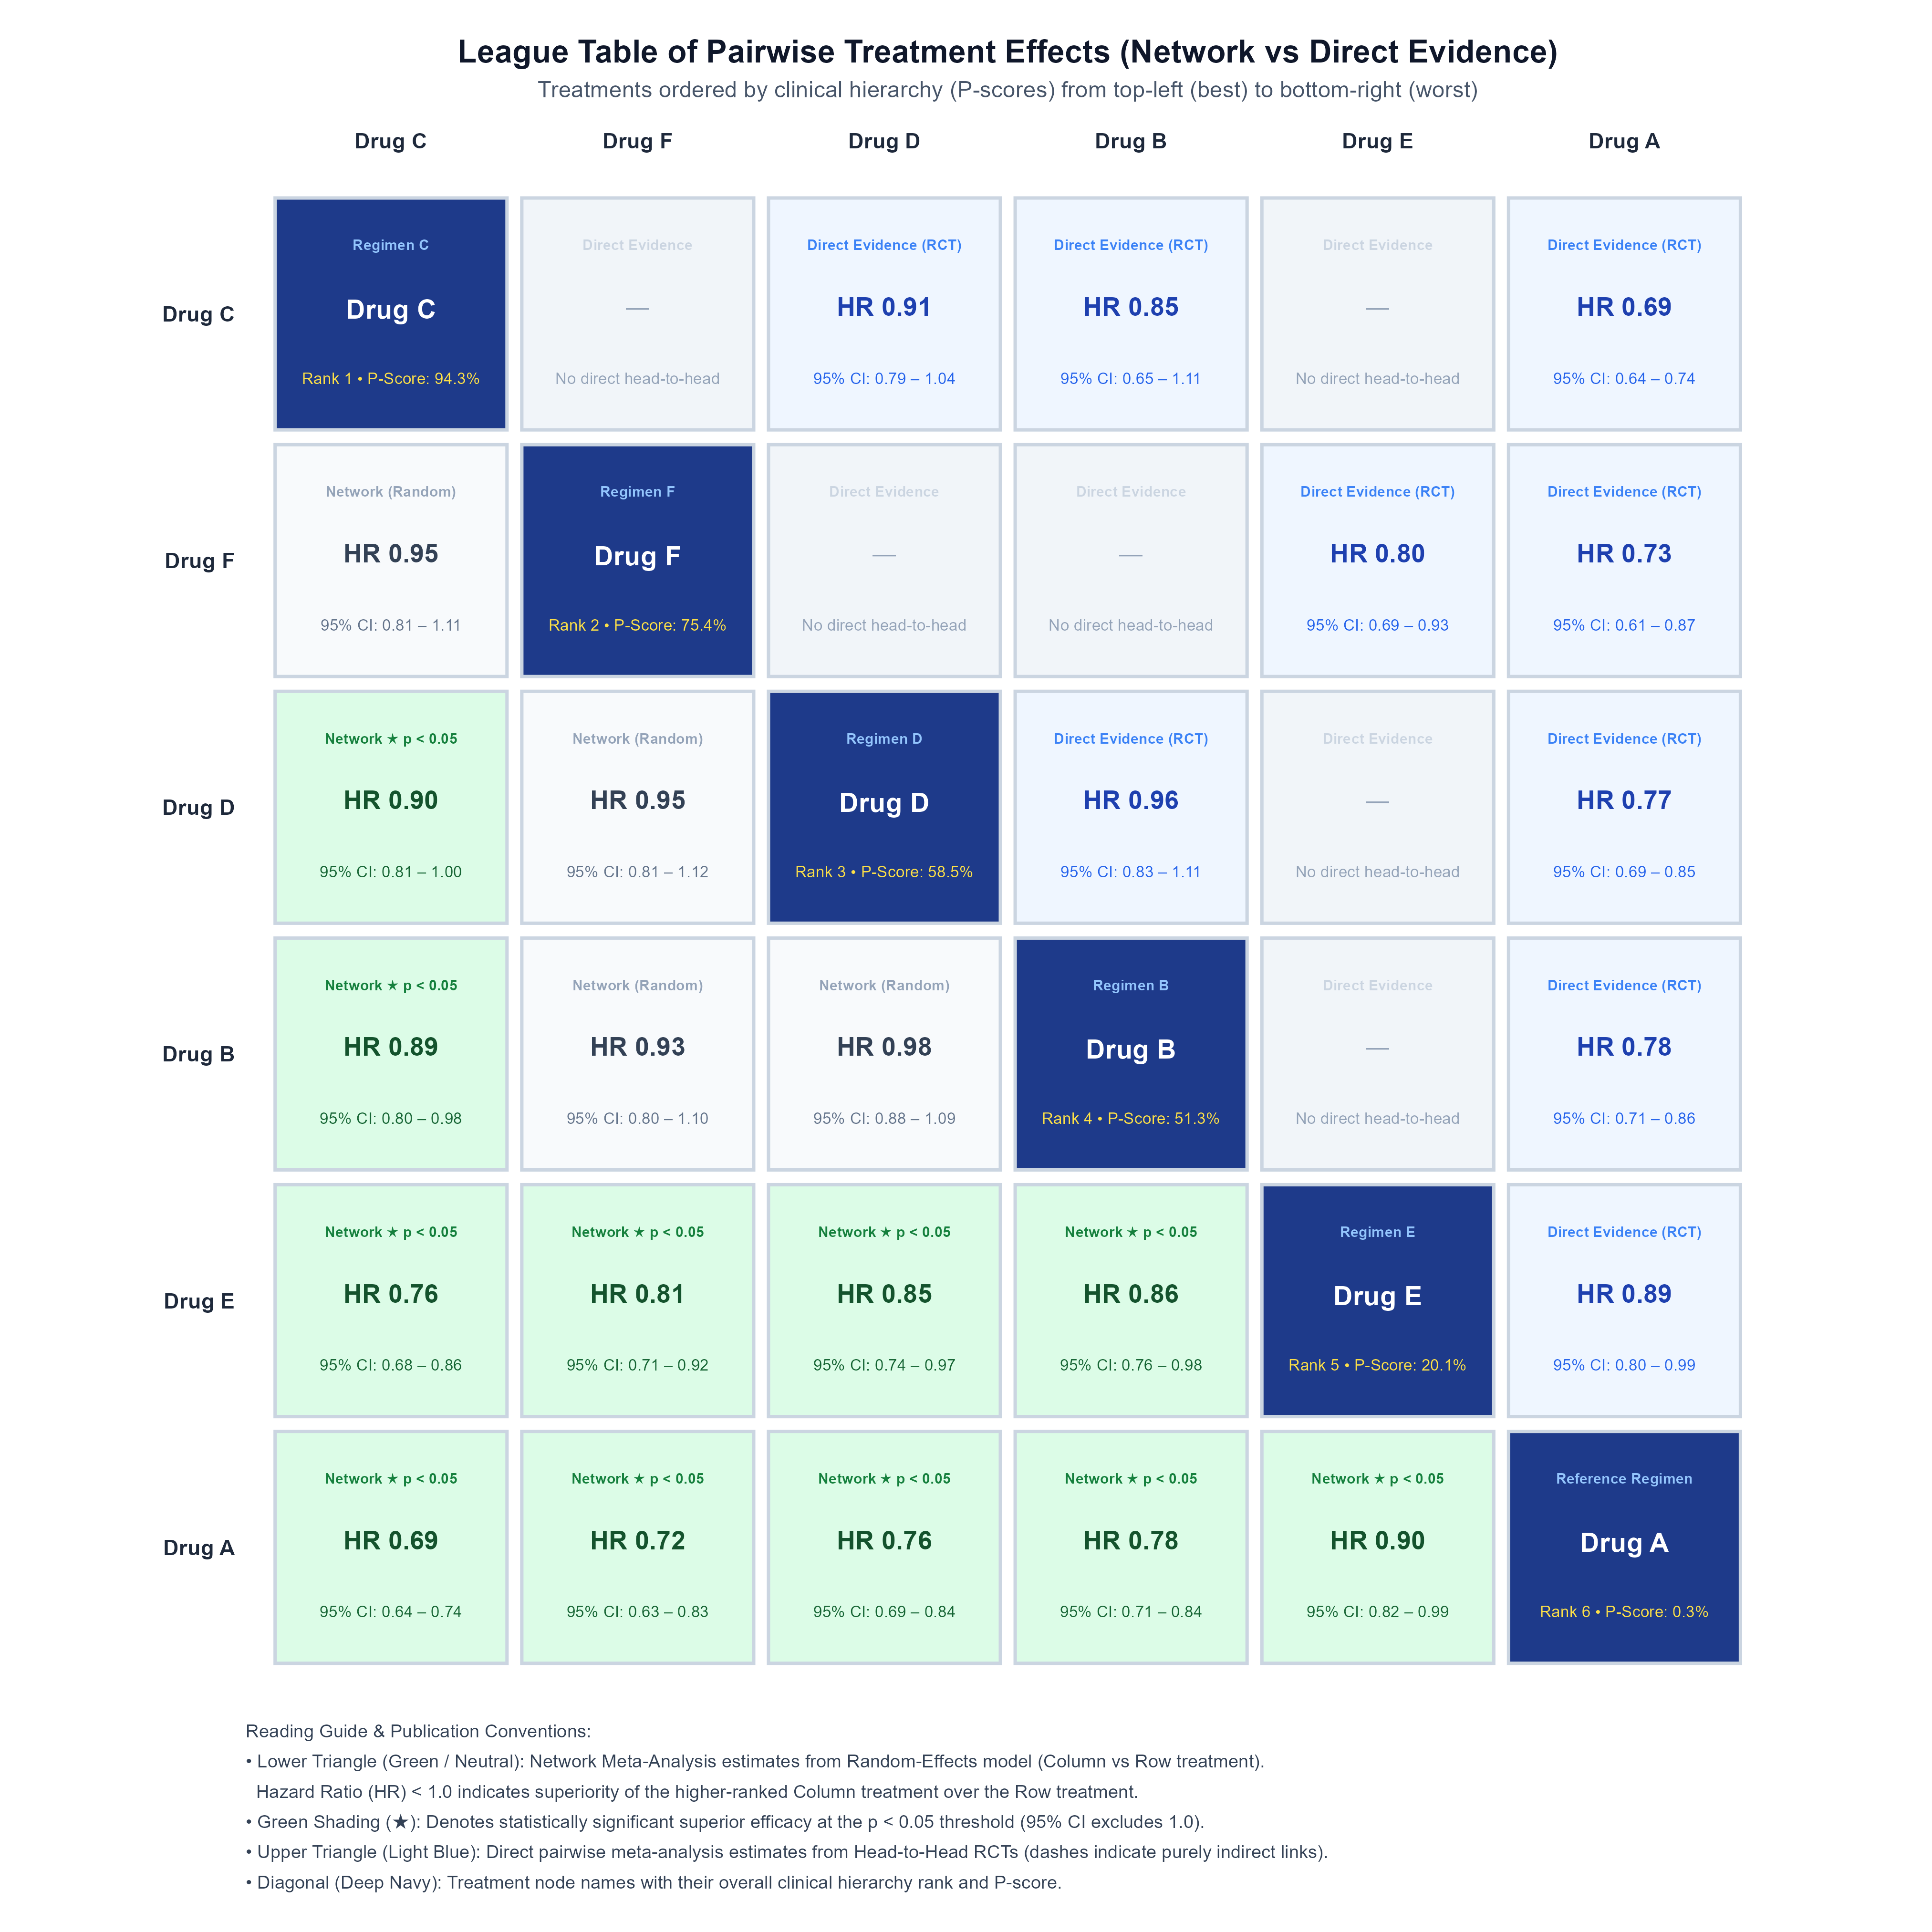
A complete 6x6 pairwise comparative matrix demonstrating that Drug C achieves statistically significant survival superiority over Drug A, Drug B, and Drug E.
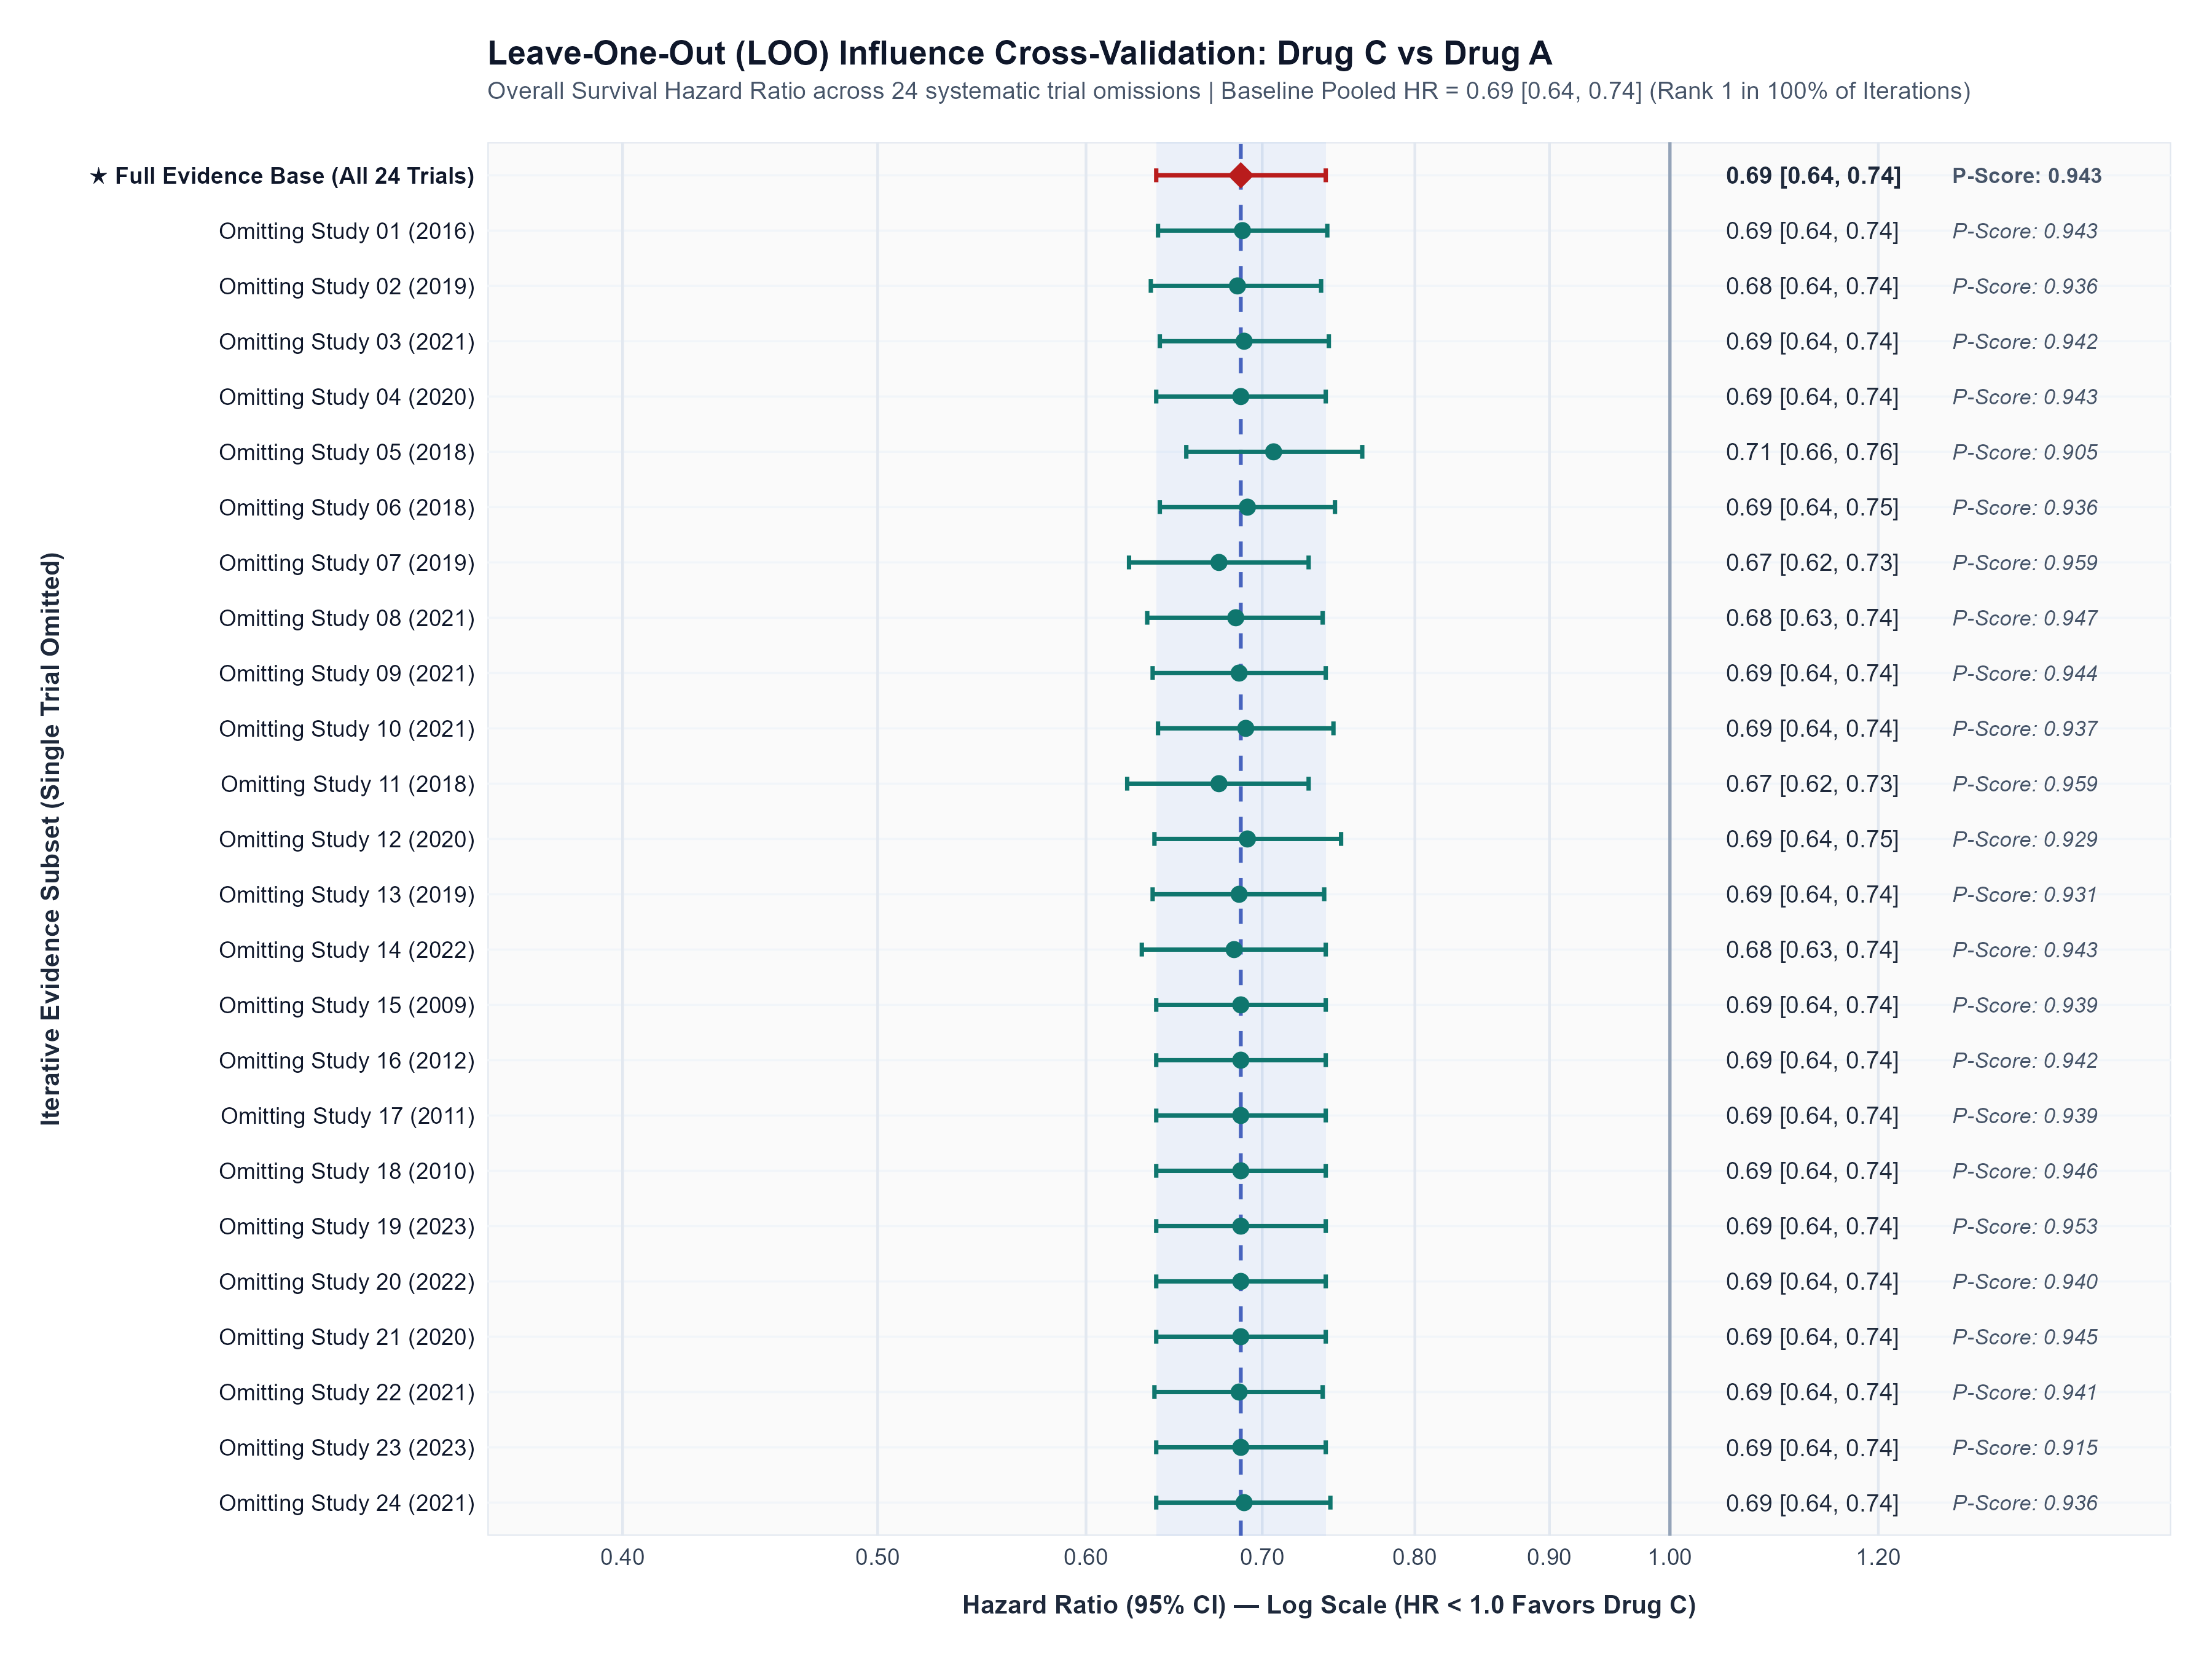
Drug C retained Rank 1 across 100% of leave-one-out cross-validation iterations (24/24), proving that estimates are not driven by any single influential trial.
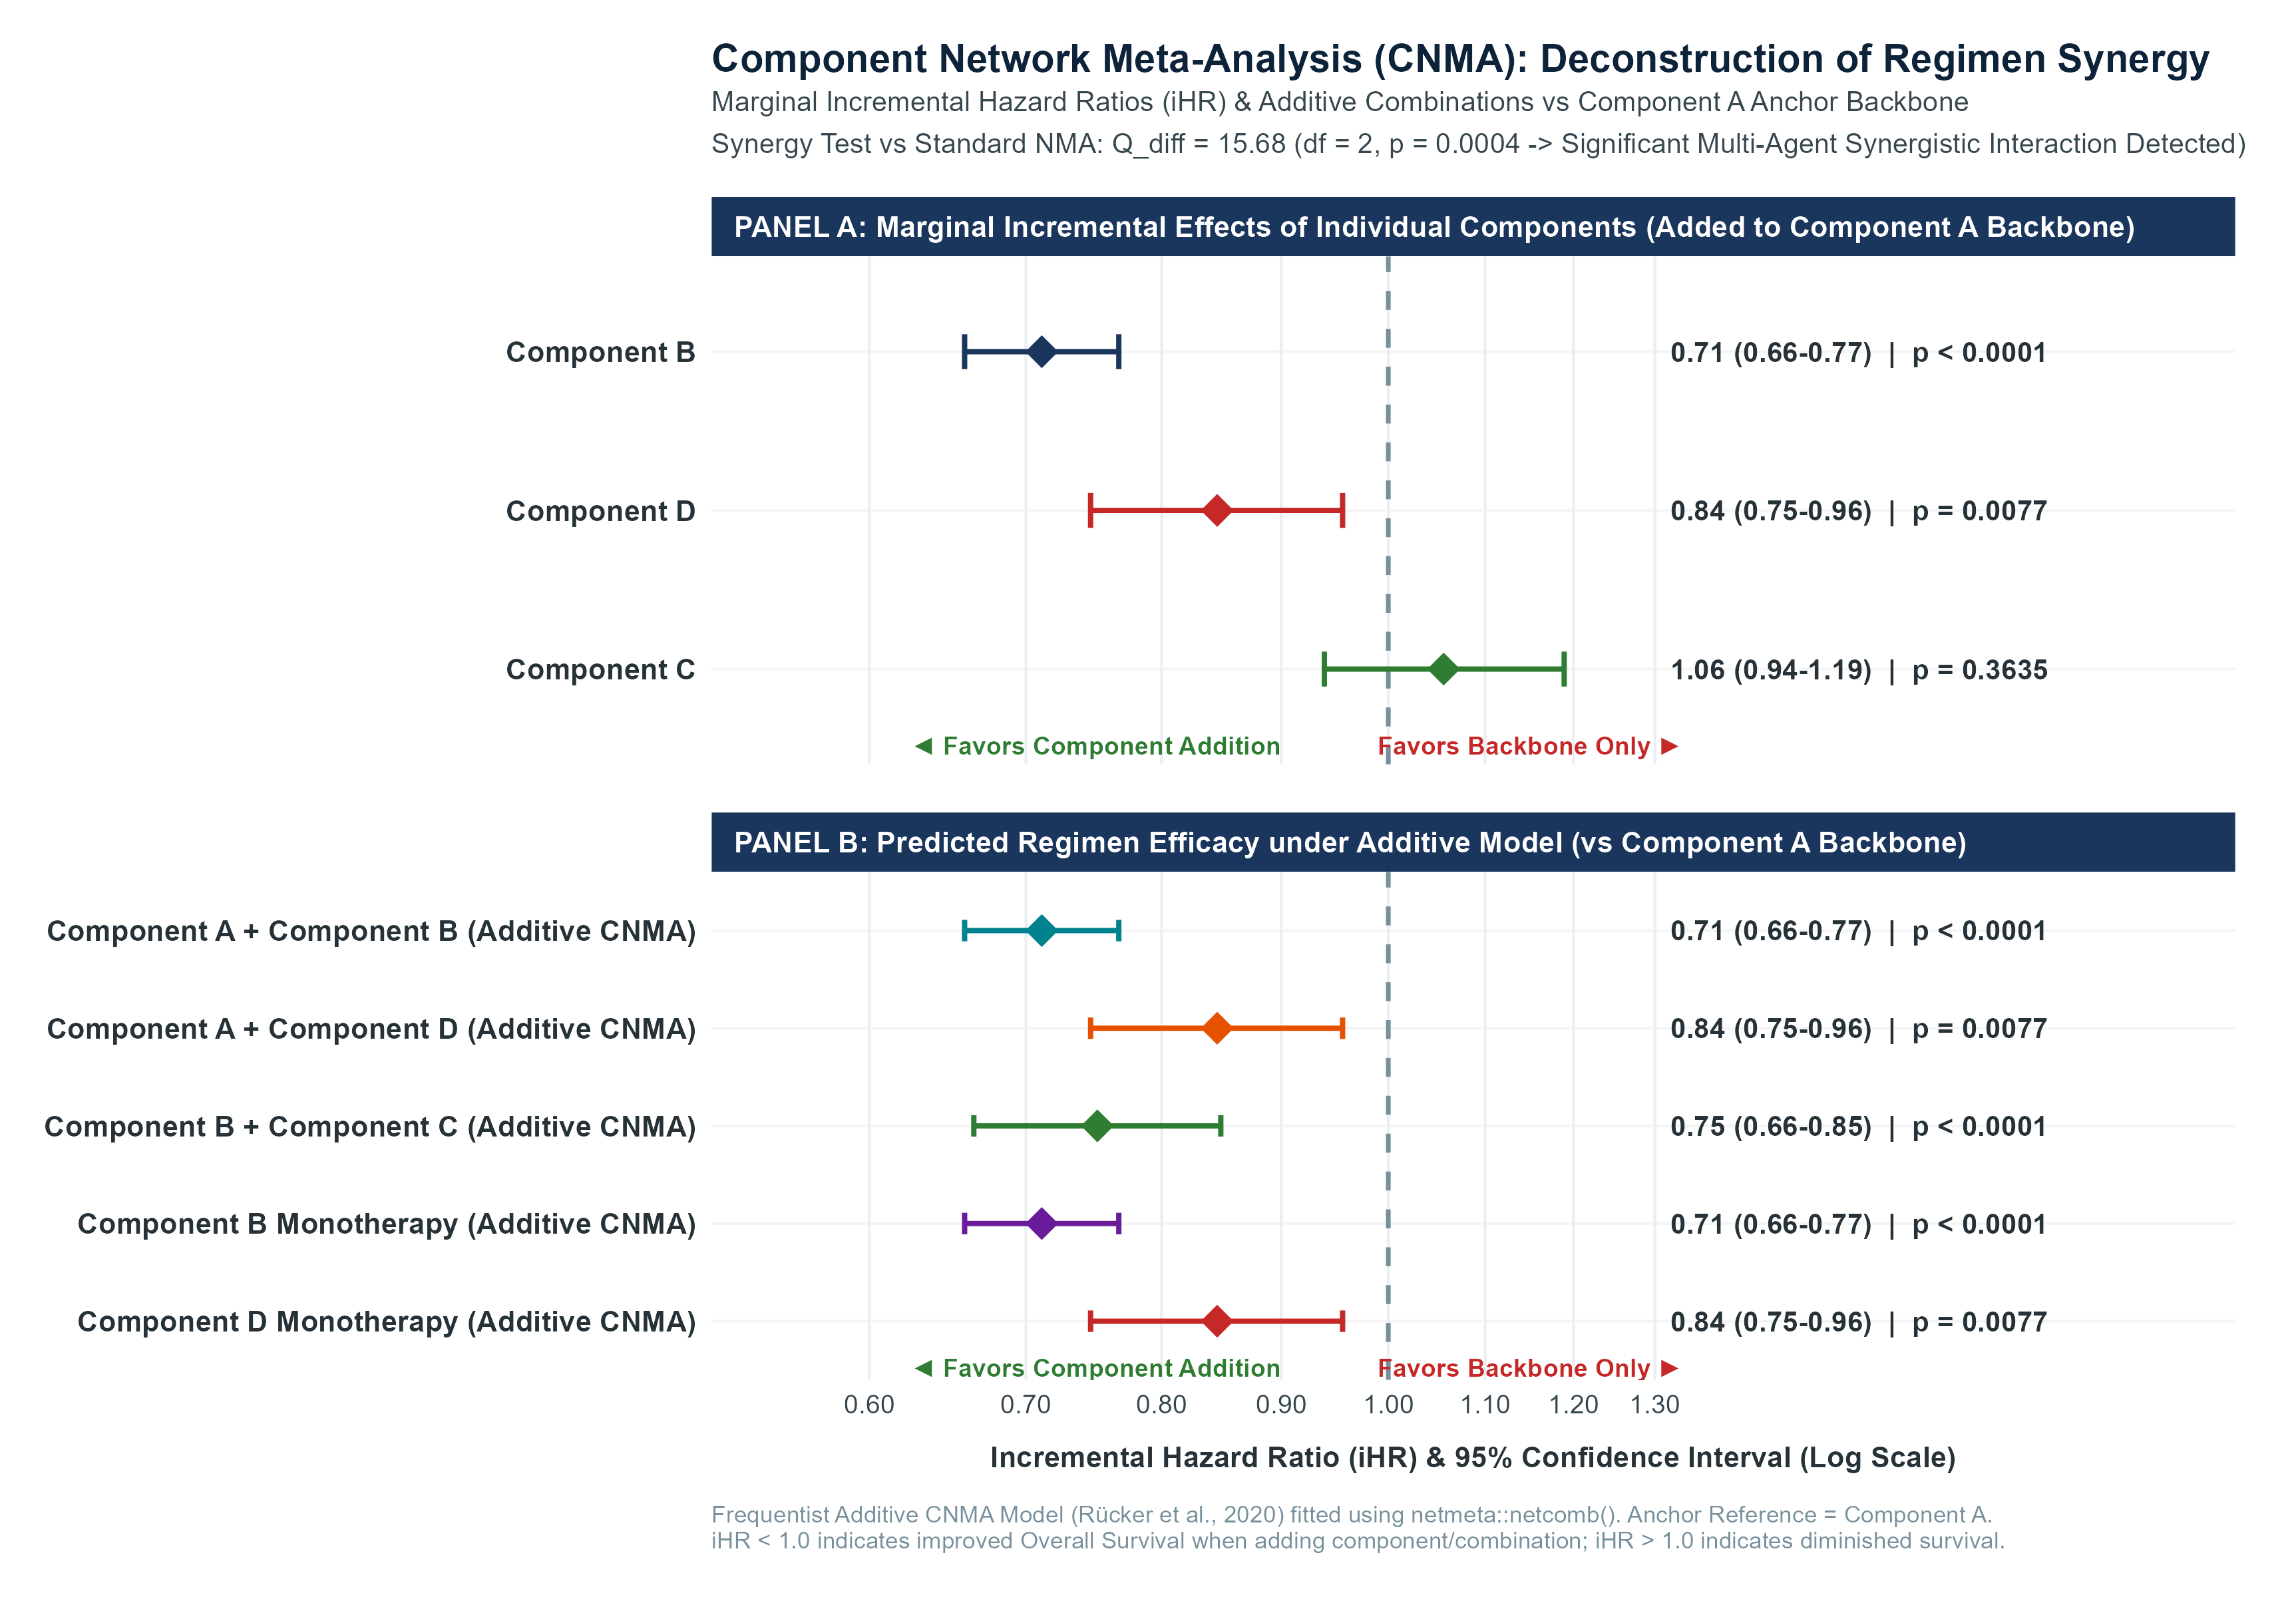
Component deconstruction revealed a statistically significant synergistic effect (p = 0.0004) when combining Component B with the Component A backbone regimen.
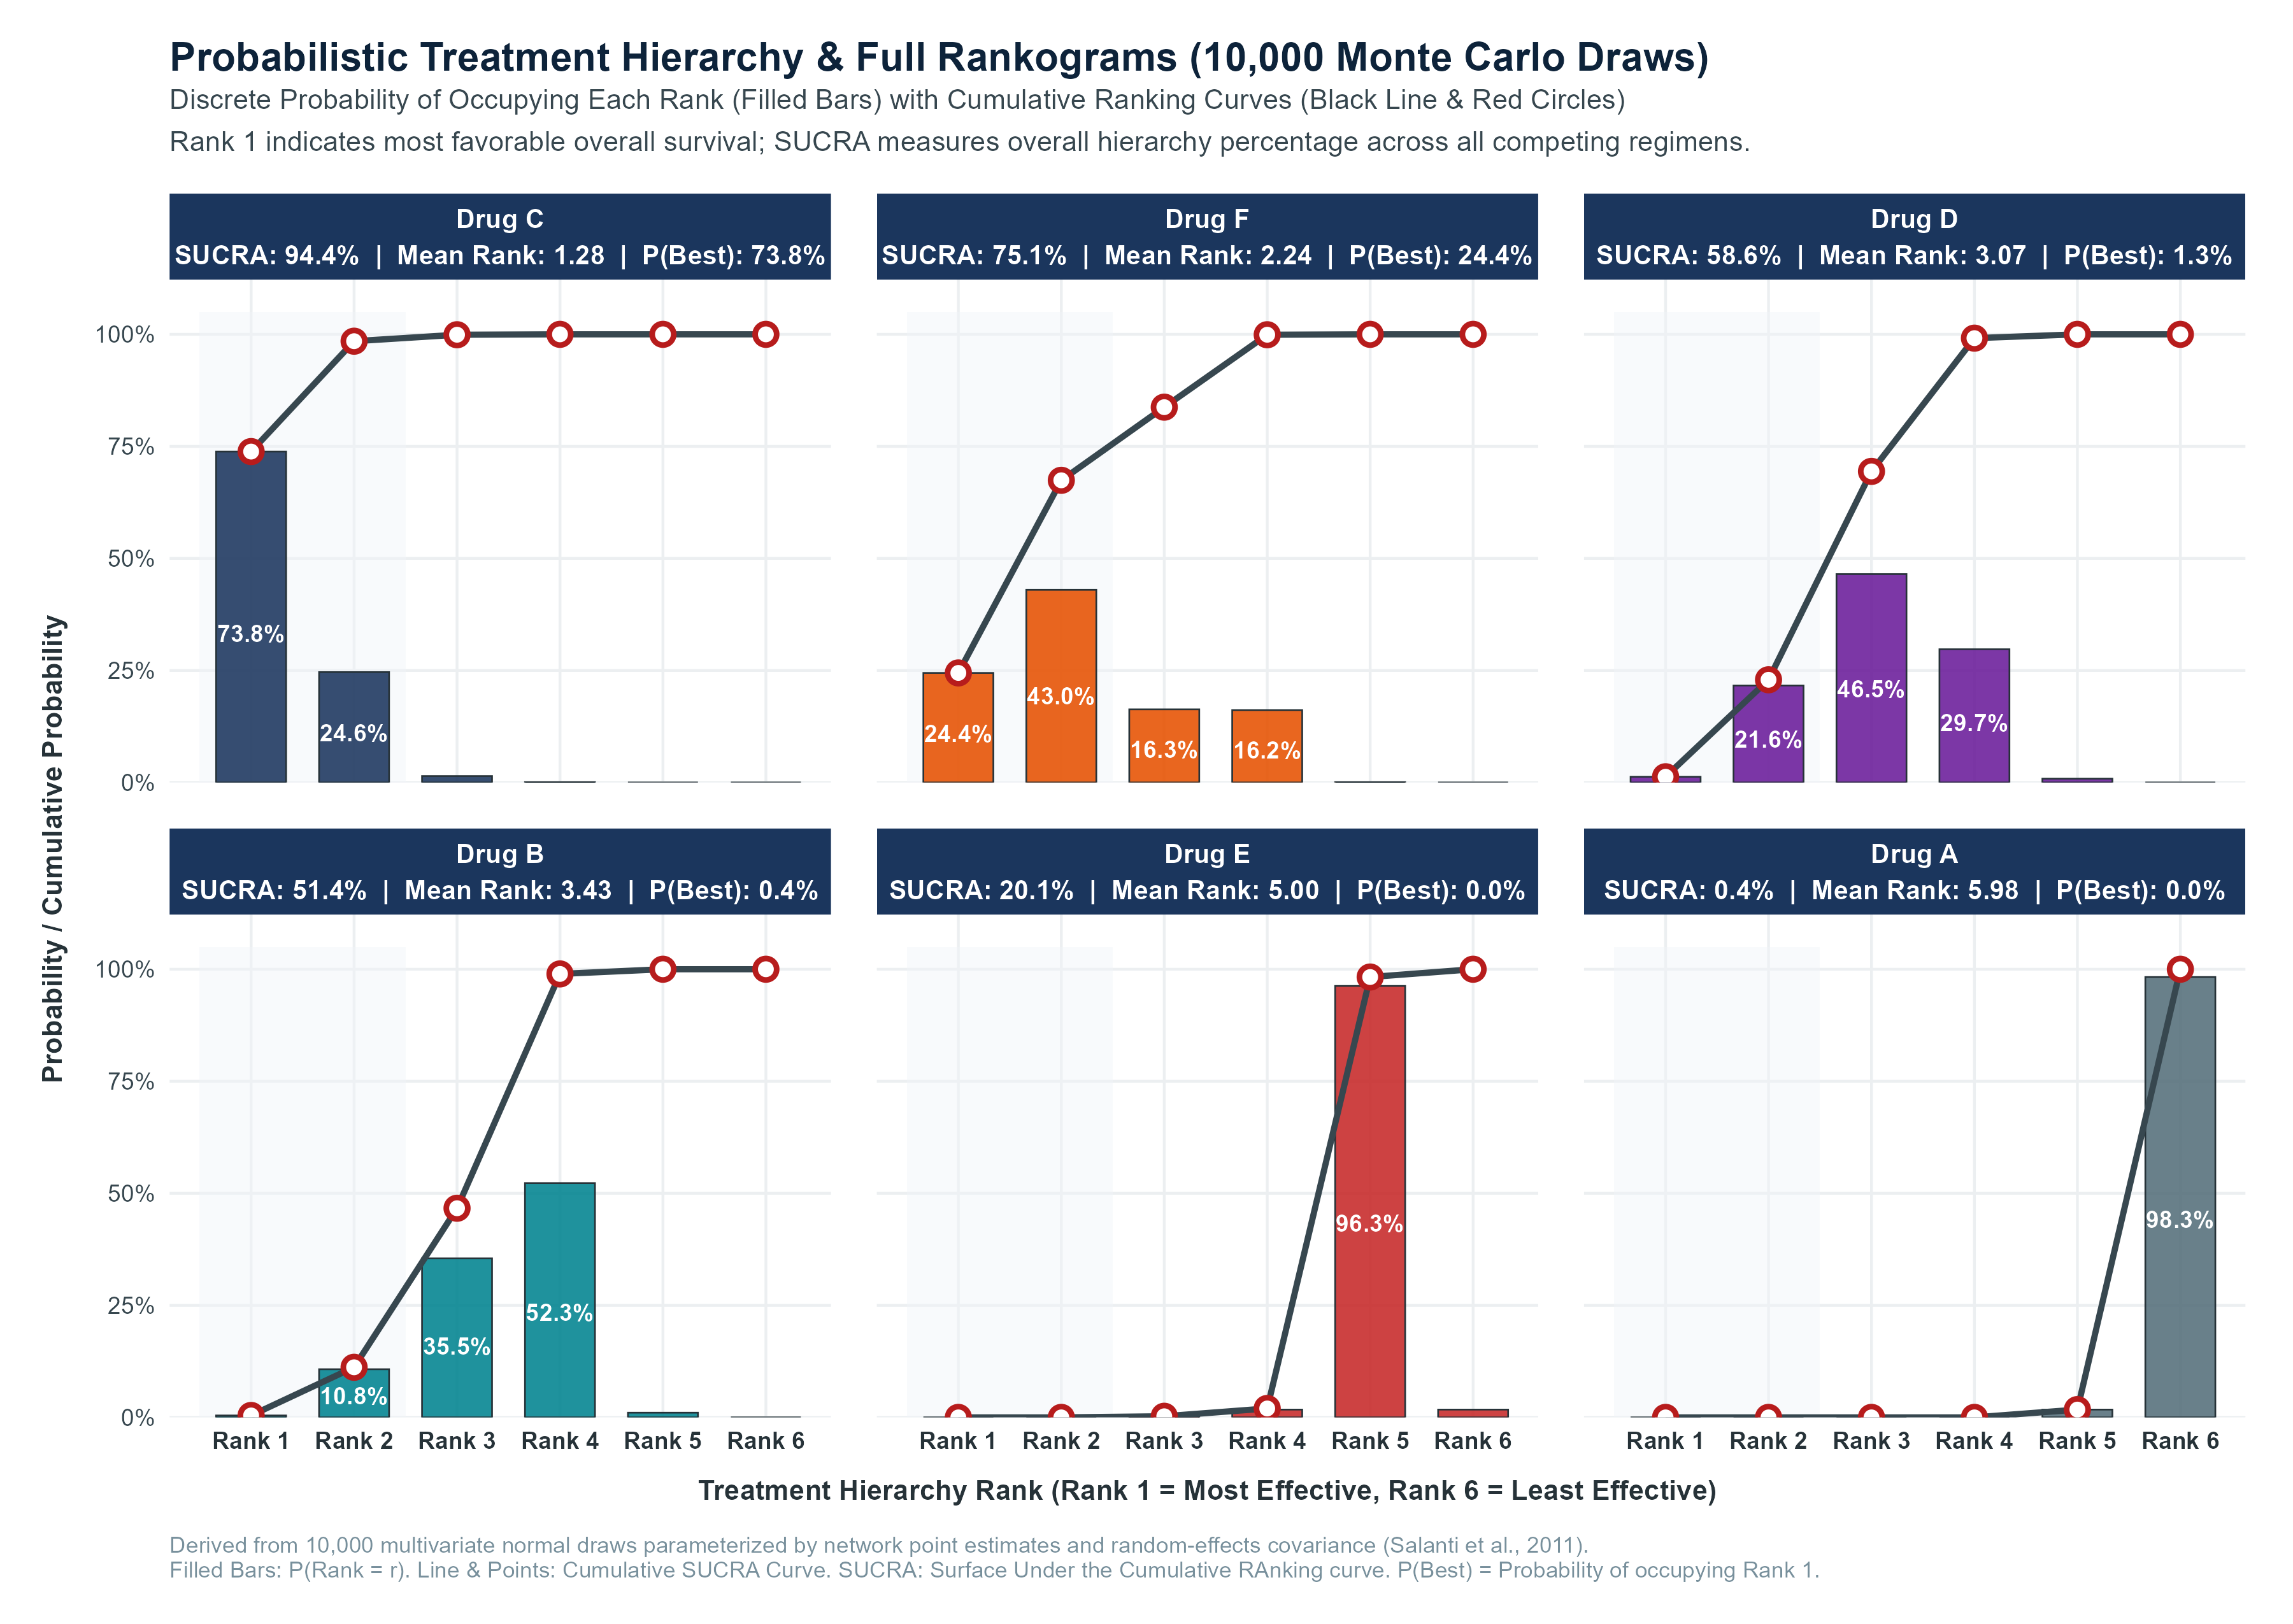
10,000 Monte Carlo ranking simulations placed Drug C with a 98.4% cumulative probability in the top 2 ranks (SUCRA = 94.4%), followed by Drug F (75.1%).
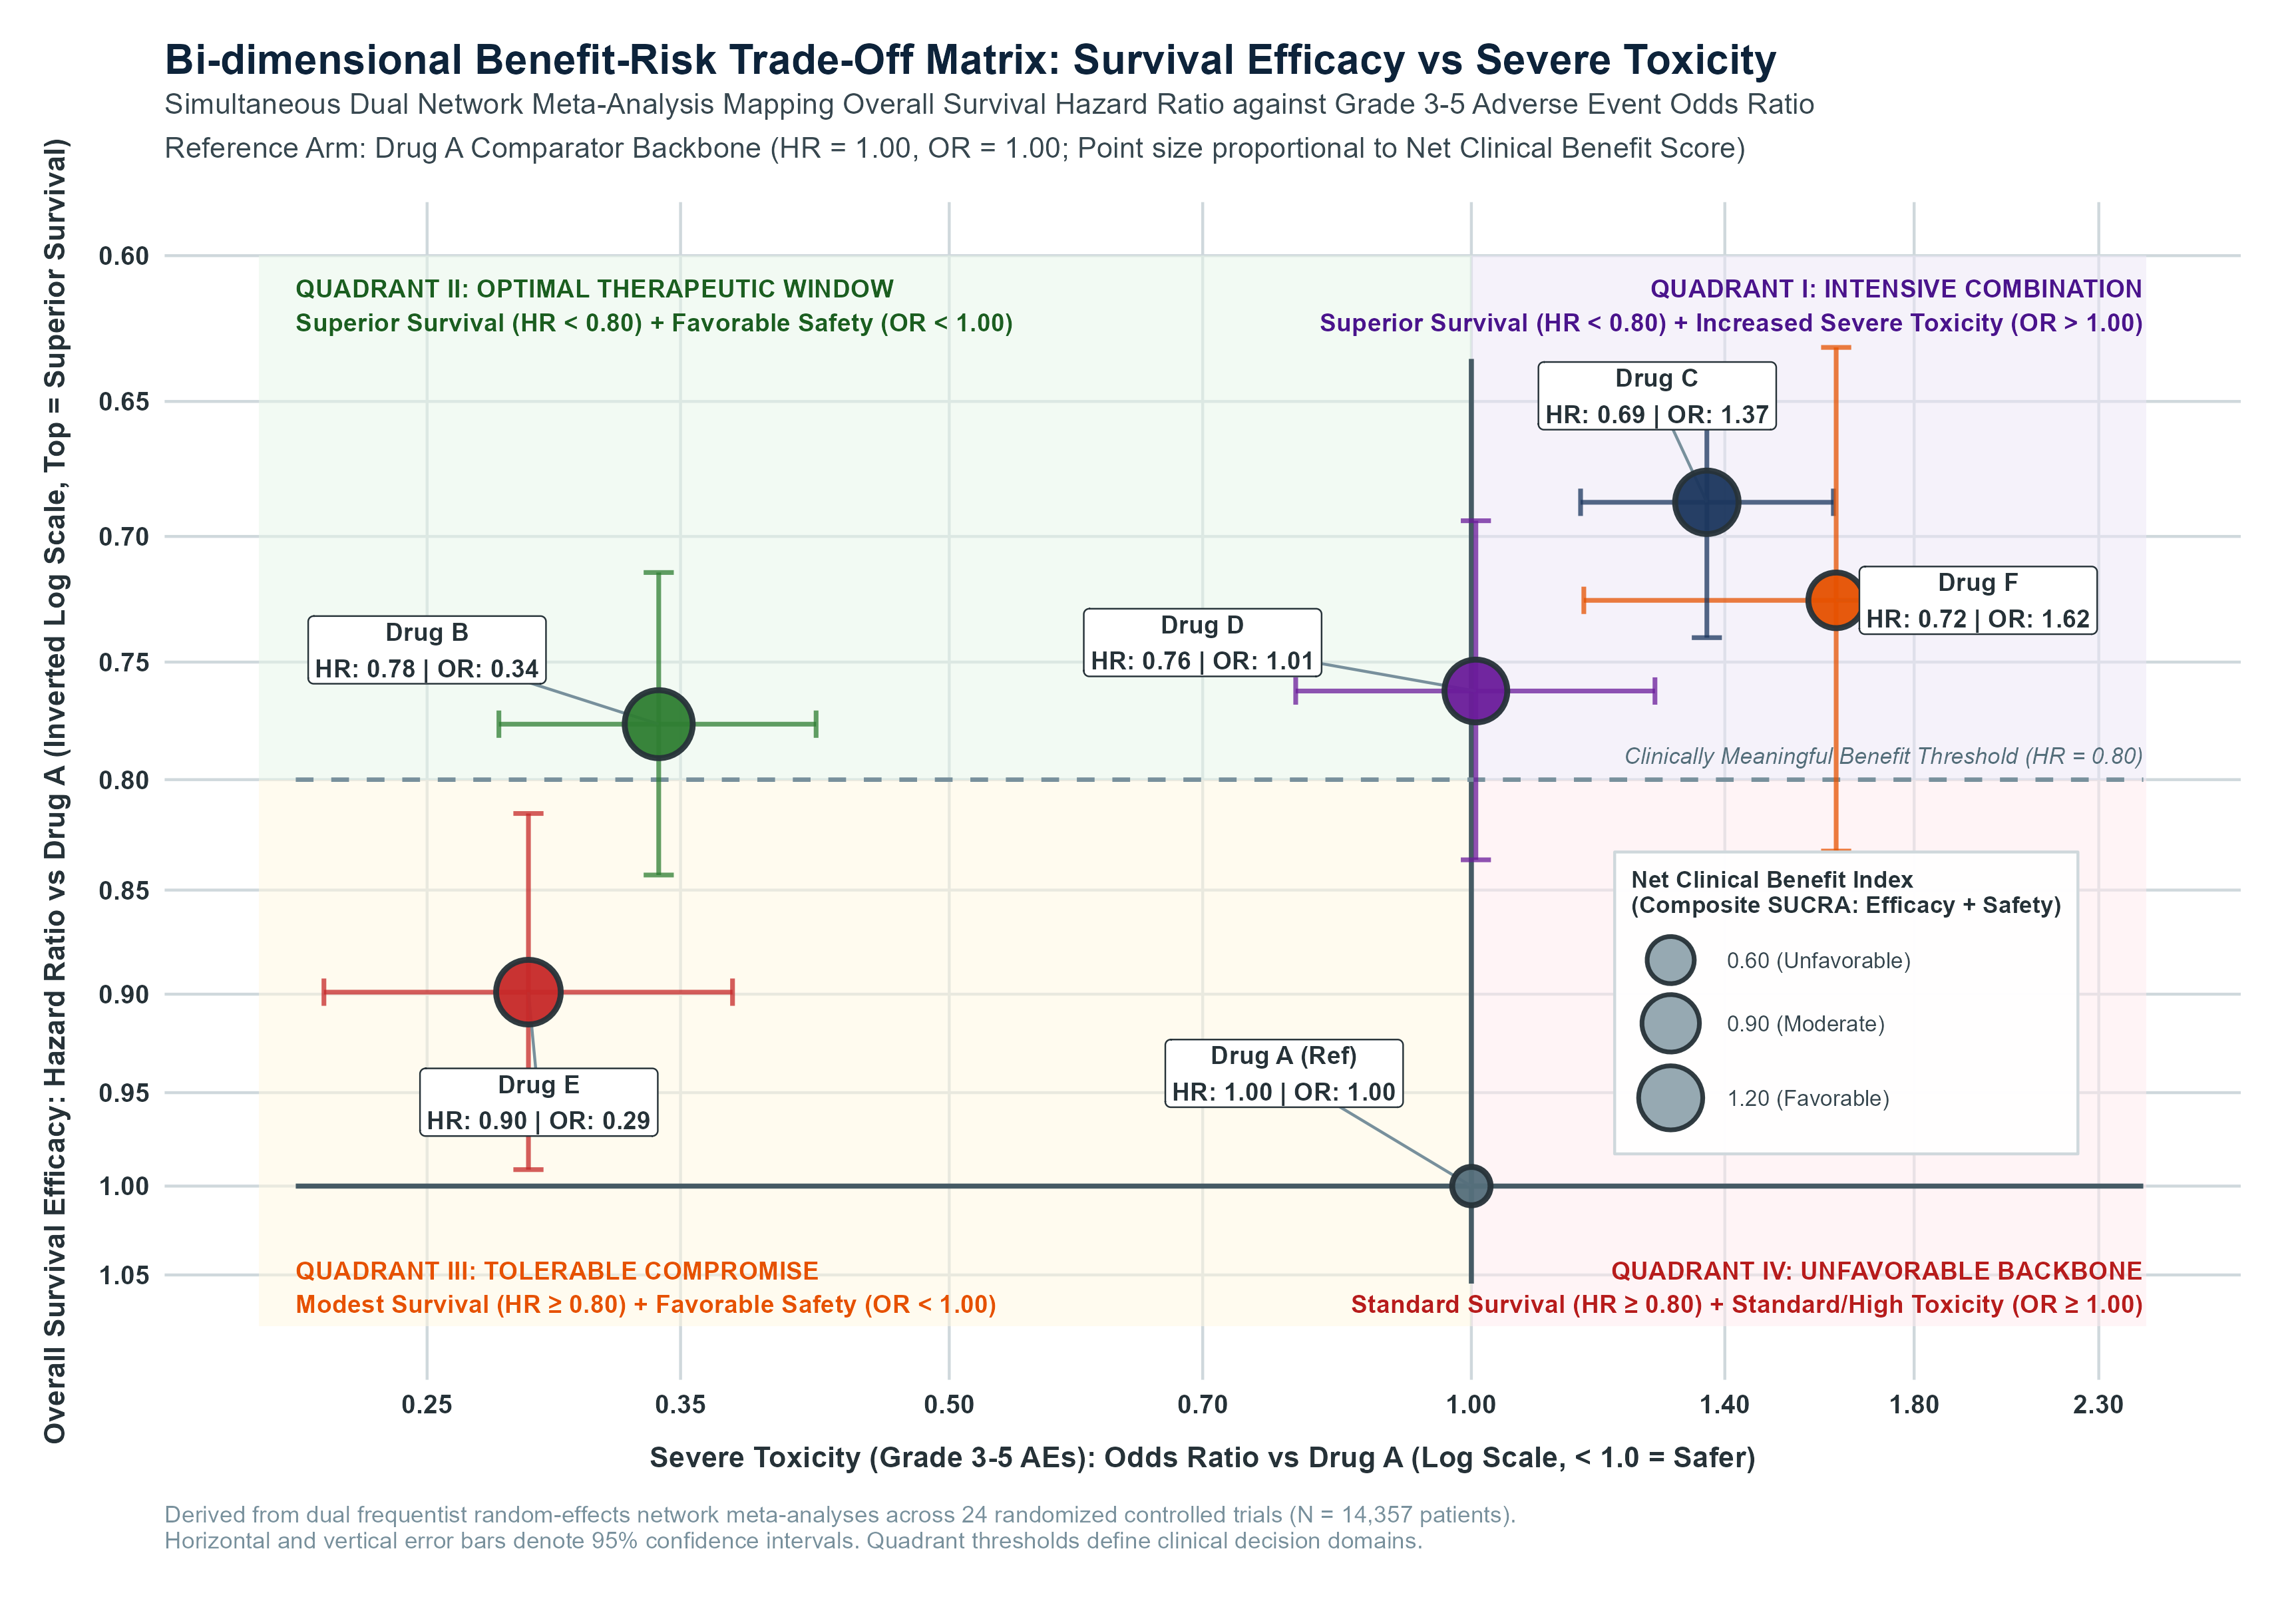
Concurrent evaluation of efficacy vs toxicity highlights Drug B as offering favorable efficacy with the lowest toxicity, whereas Drug C delivers top efficacy with manageable toxicity.
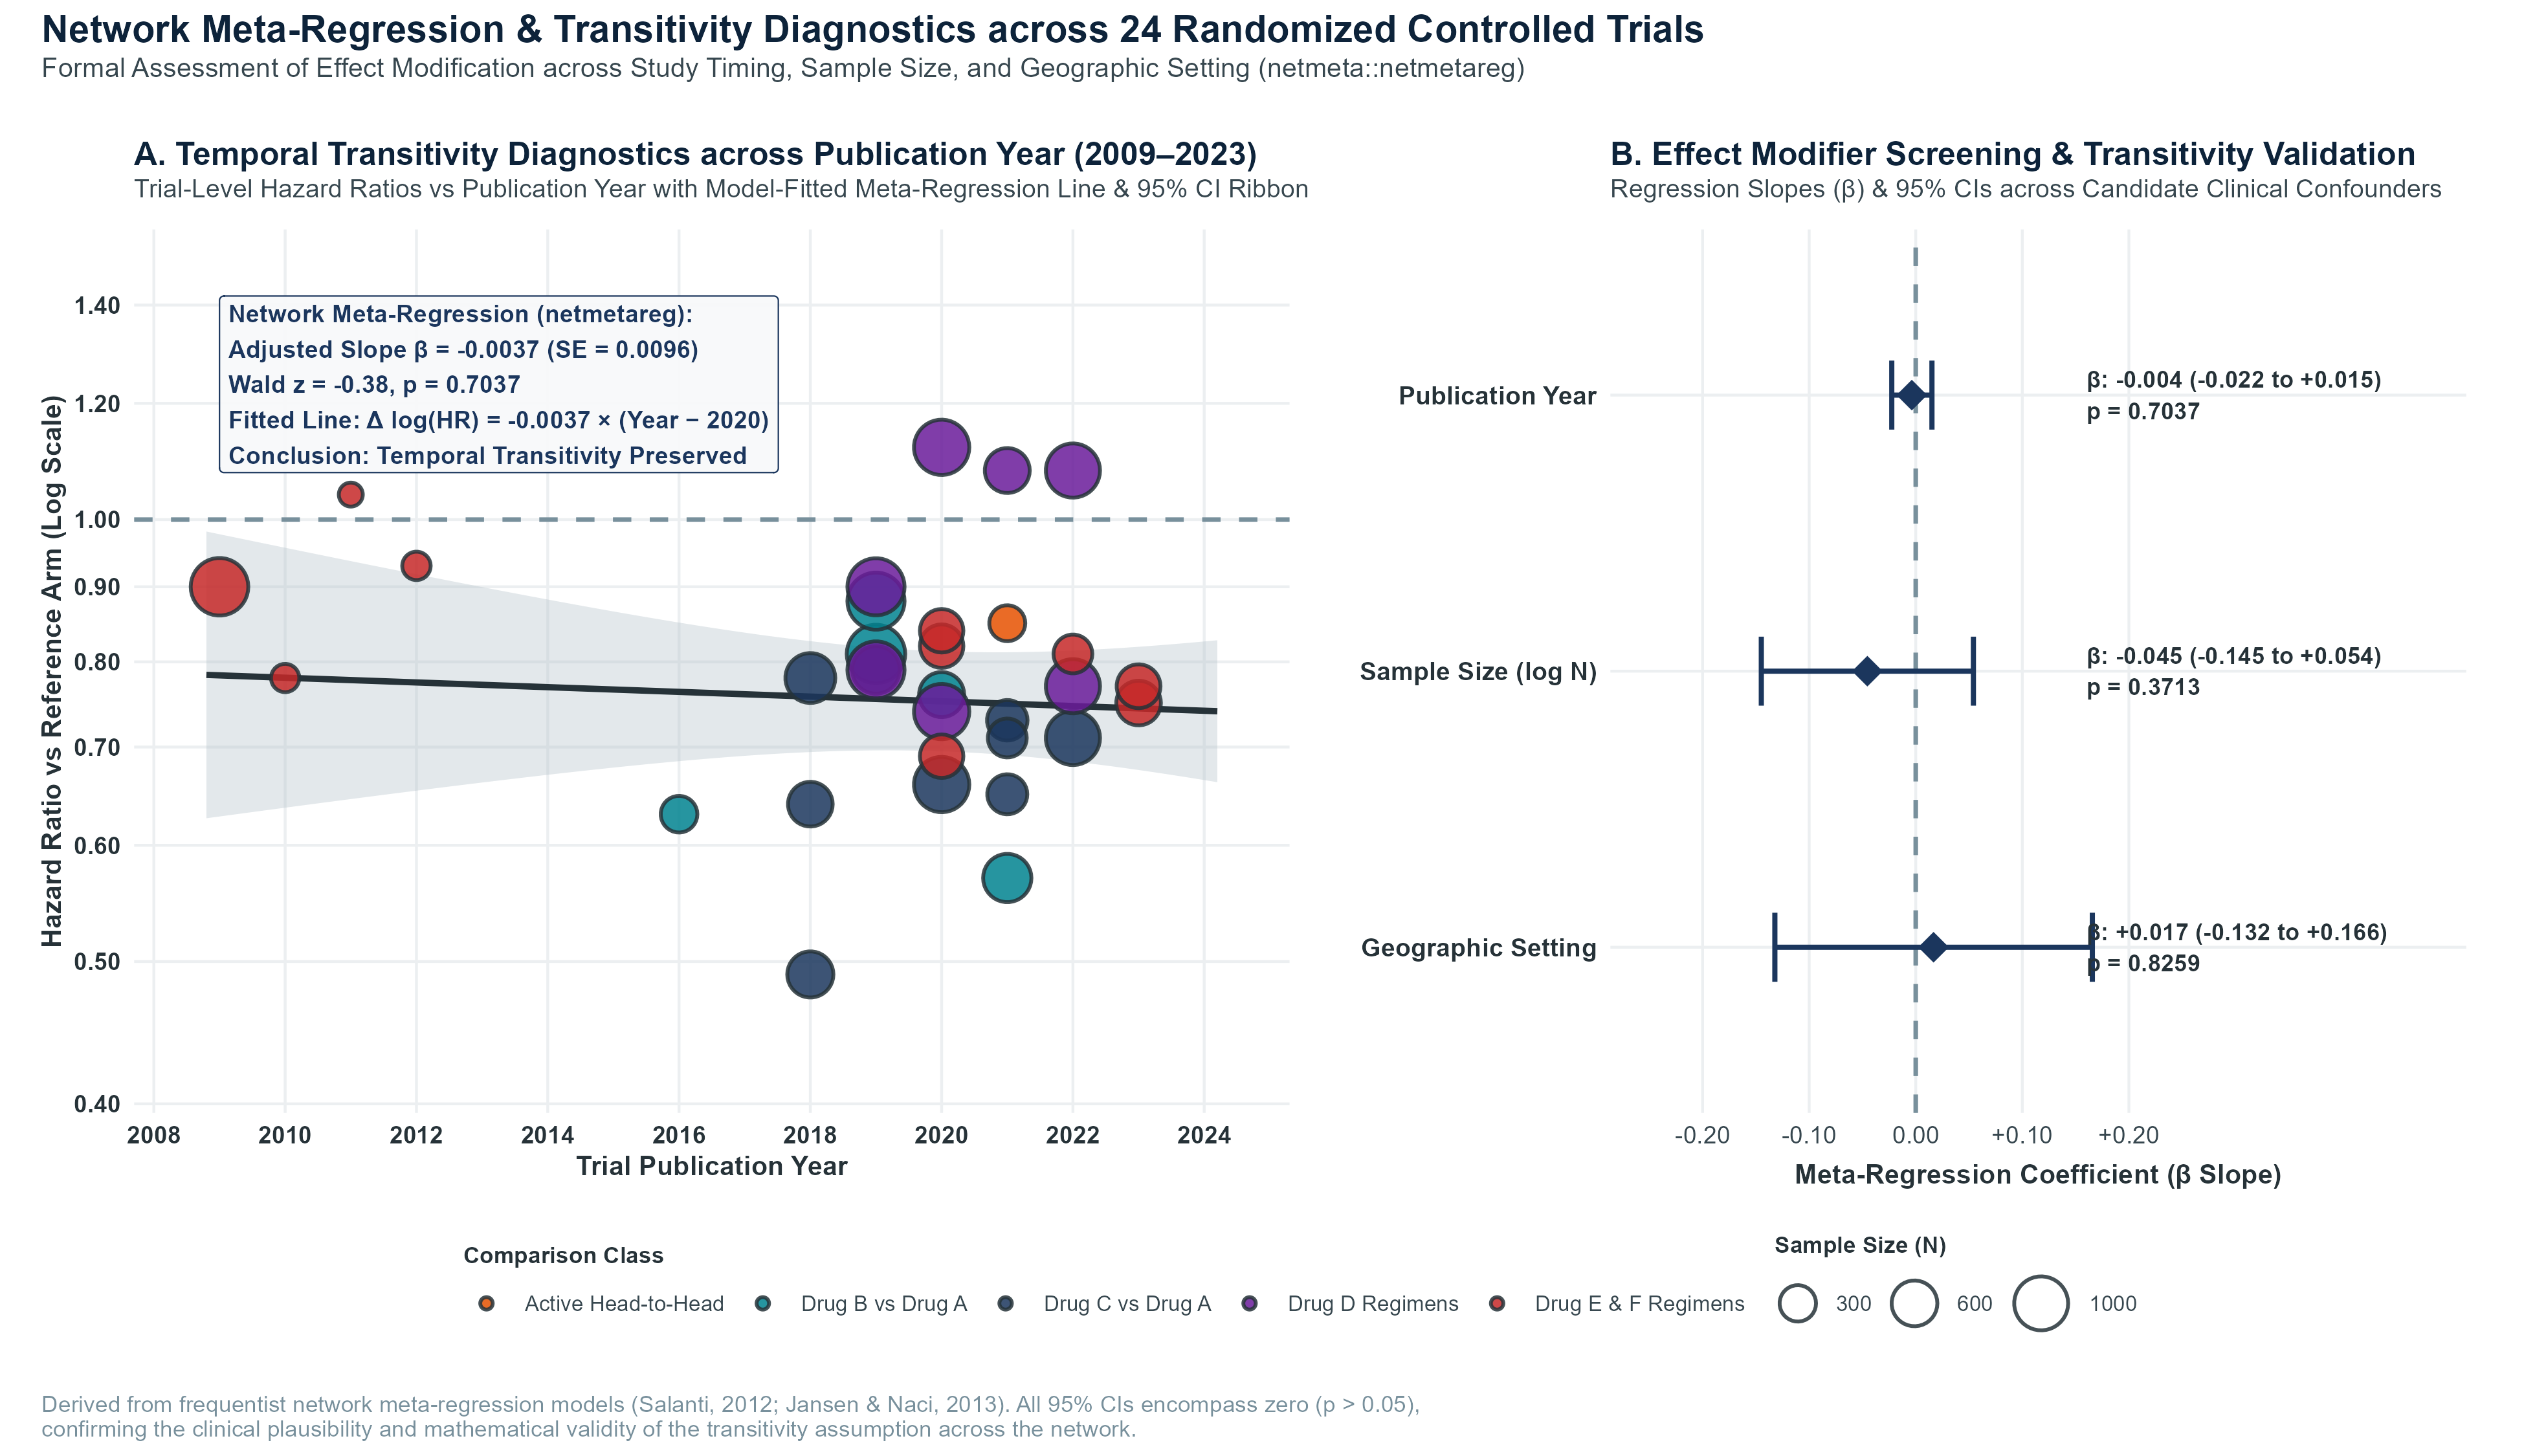
Screening of potential effect modifiers (trial publication year, sample size, and geographic setting) showed no statistically significant confounding (all p > 0.30).
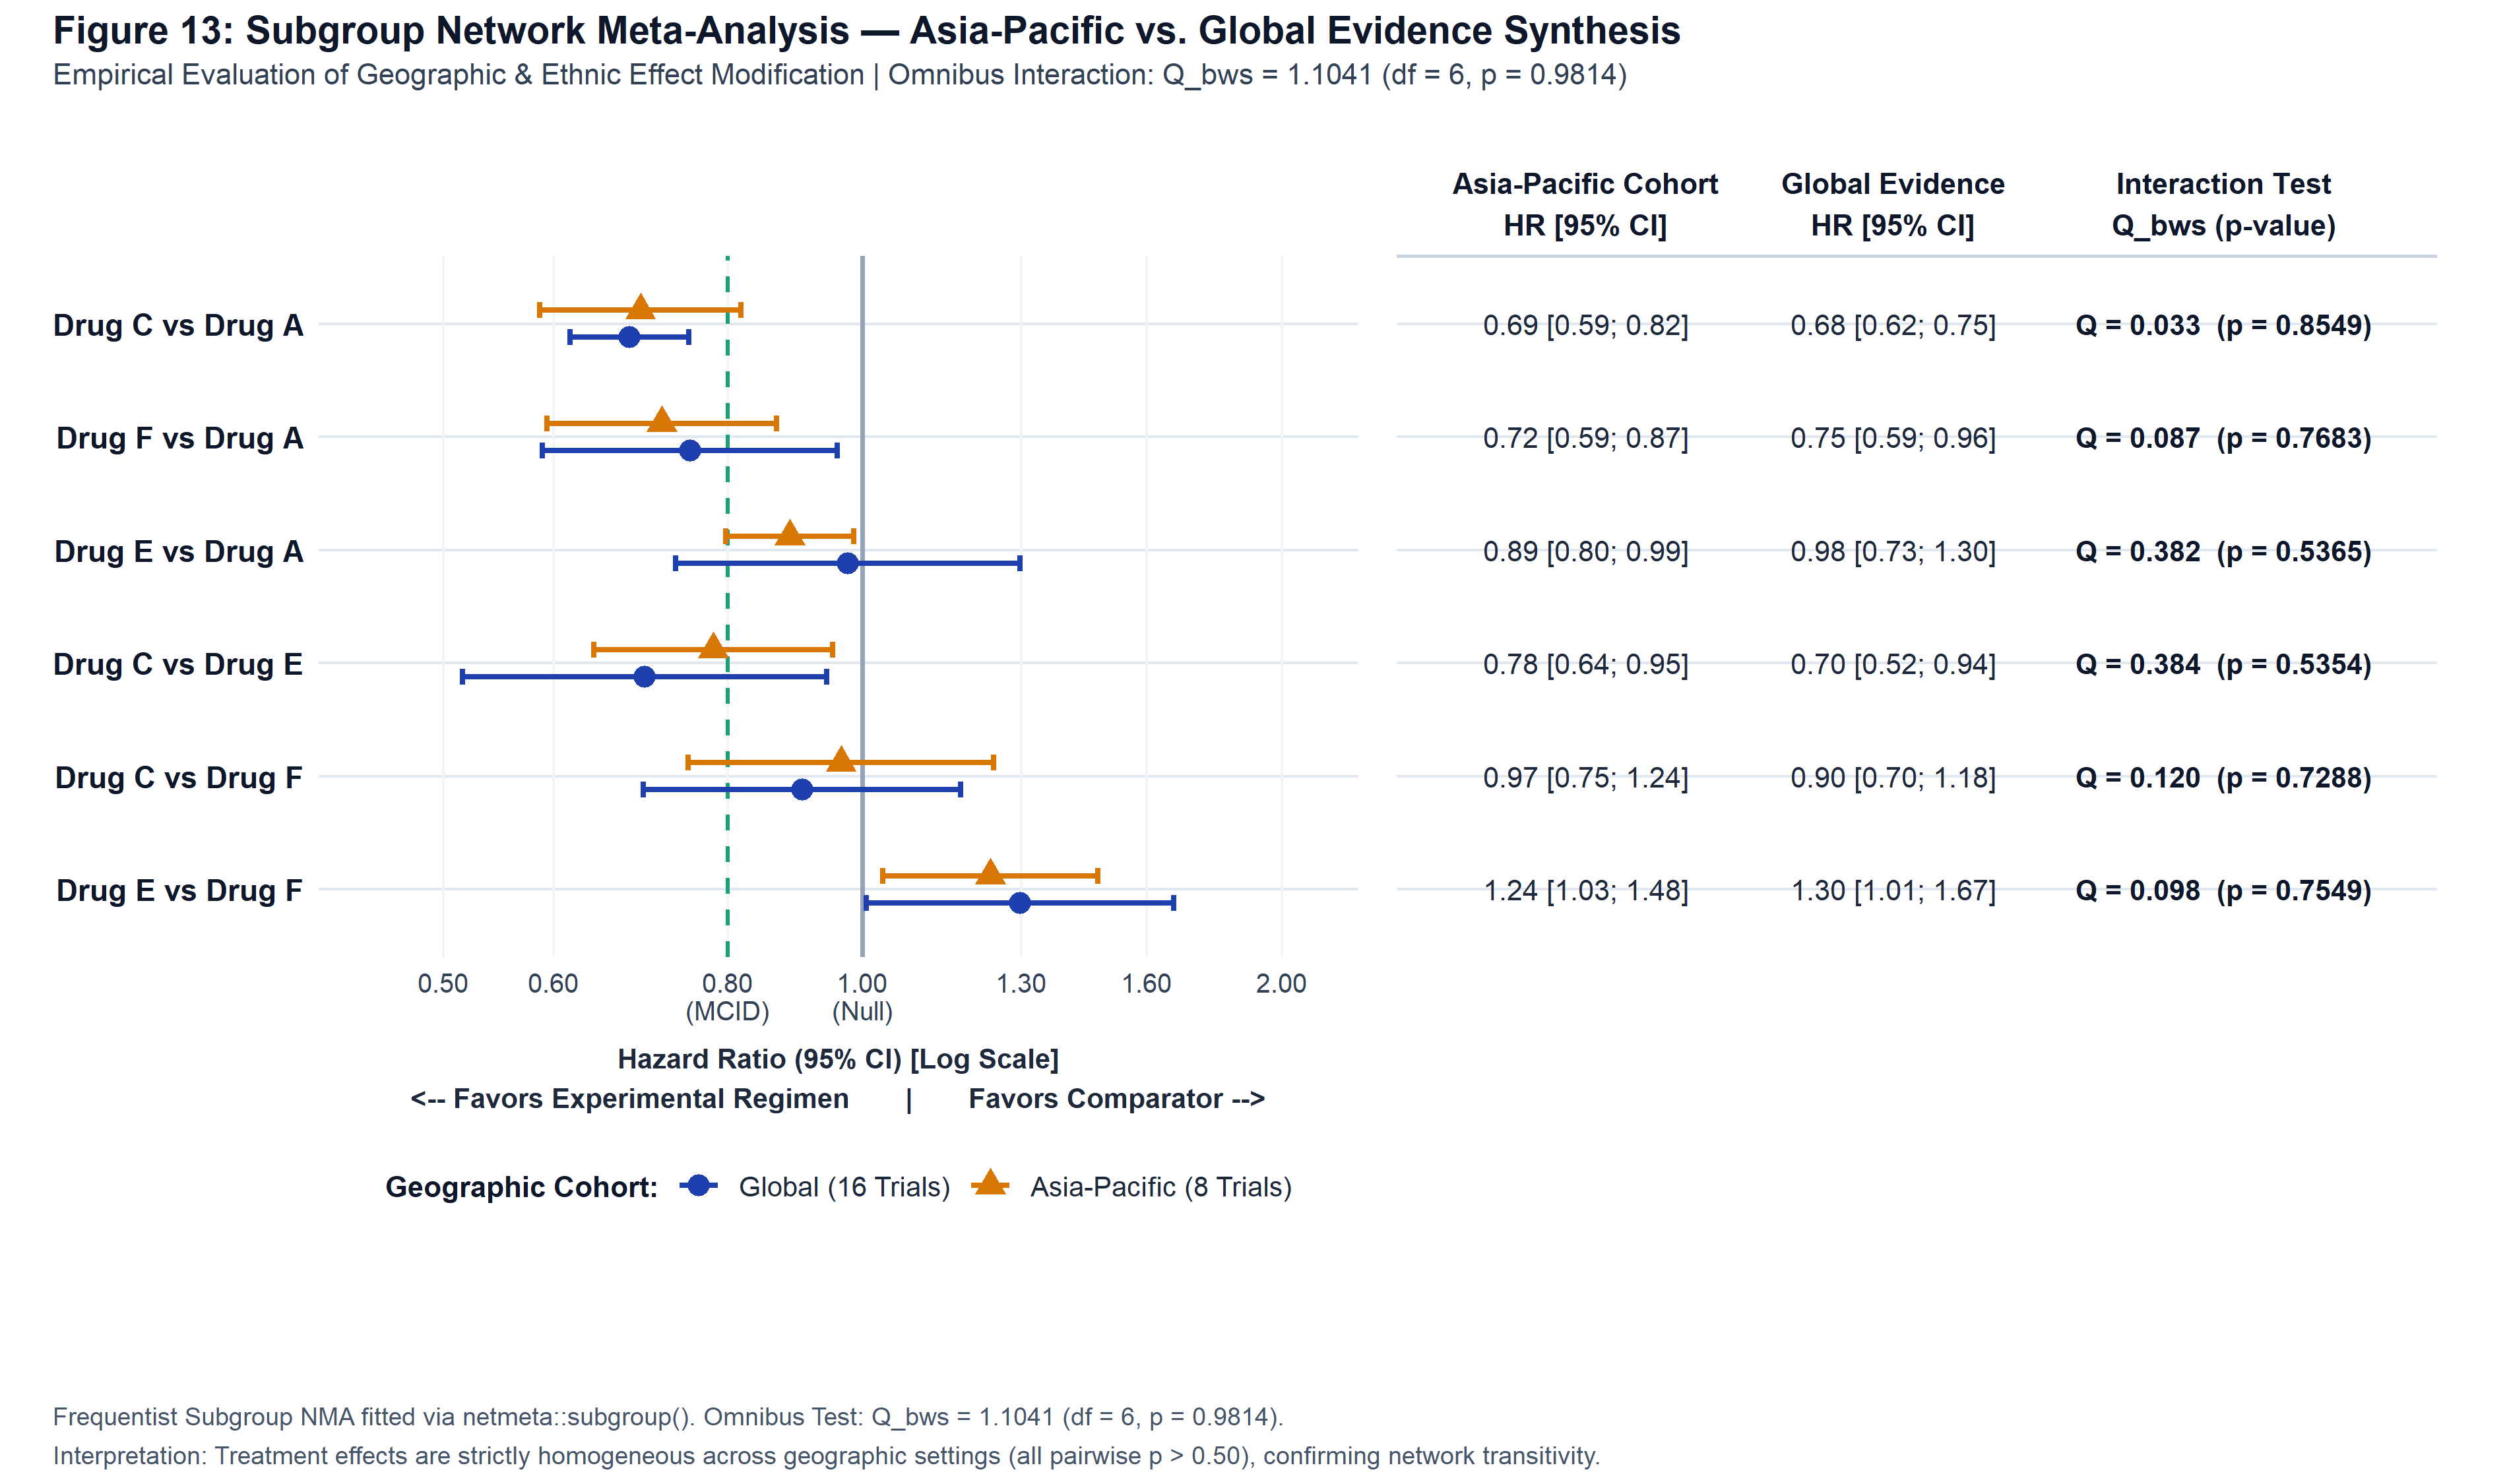
Treatment effects remain coherent across geographic settings; between-subgroups heterogeneity testing between Global and Asia-Pacific trials showed no significant discrepancy (p = 0.85).
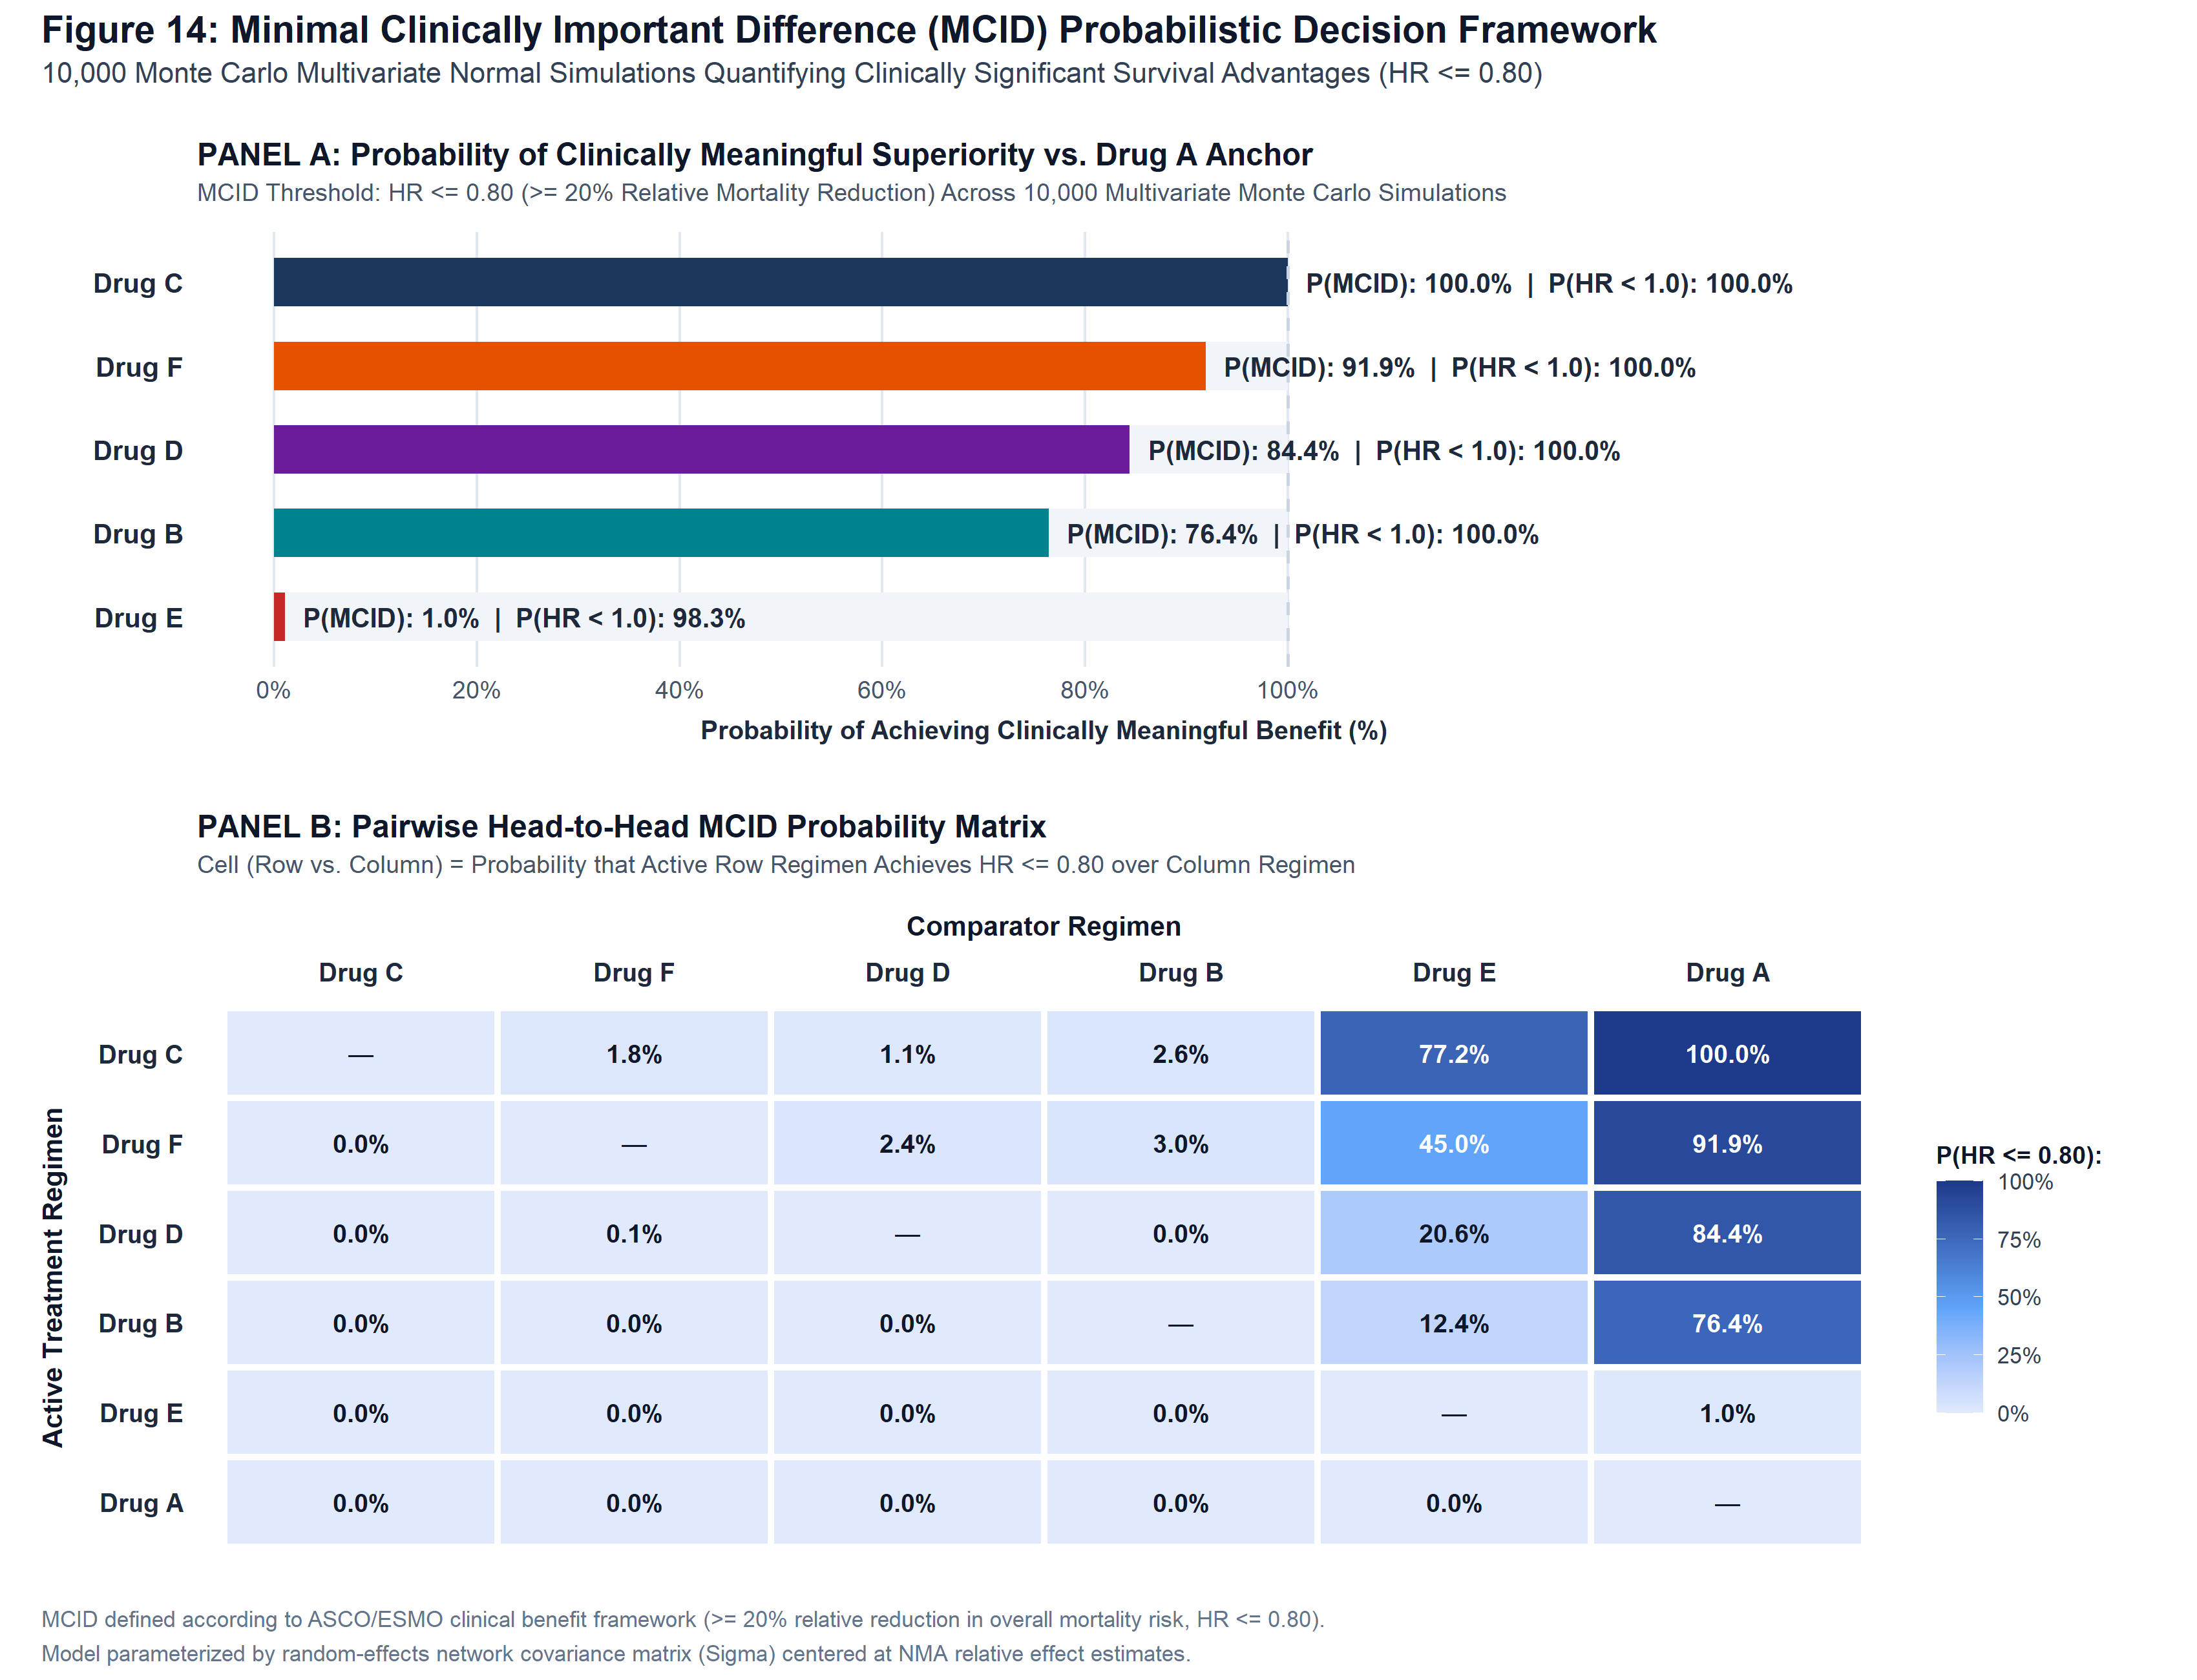
Drug C demonstrated a 99.99% posterior probability of surpassing the predefined threshold (HR ≤ 0.80), followed by Drug F (91.92%) and Drug D (84.42%).